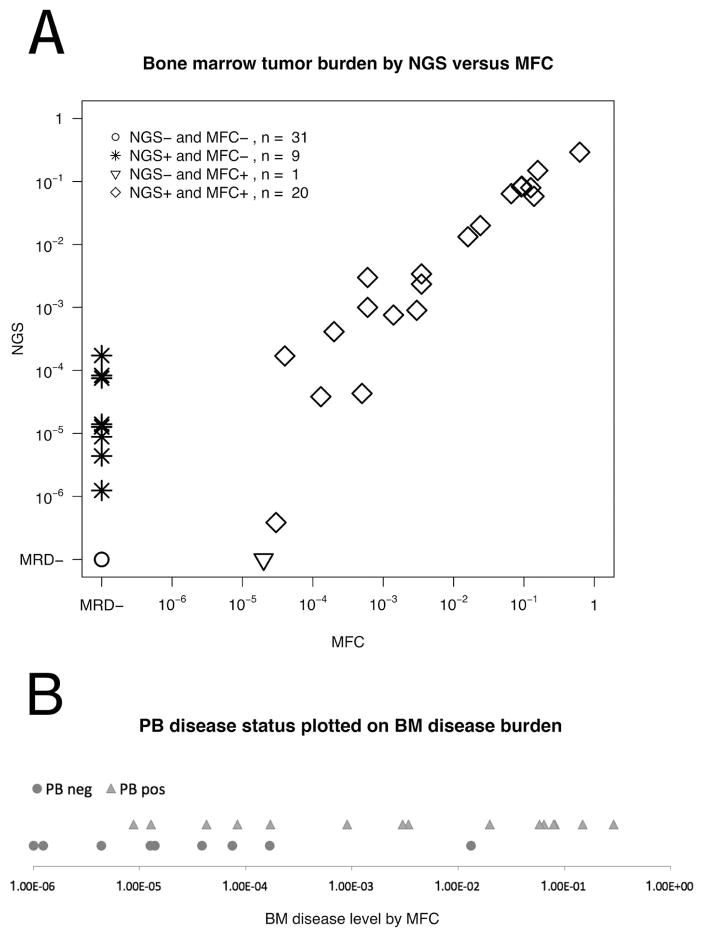
Figure 1.
A. Comparison of tumor burden measurements obtained by NGS (Y axis) and MFC (X axis) in 61 BM specimens. Diamonds represent the 20 specimens positive both by NGS and MFC. The triangle denotes the single specimen negative by NGS and positive by MFC. Asterisks show 9 samples positive by HTS and negative by MFC. Circles show 31 specimens negative by both methods. NGS is presented as a fraction of the total nucleated cells calculated using the % B cells determined by MFC, and MFC as a fraction of total white blood cells. NGS and MFC values of disease burden are highly correlated (R2 = 0.91, P < 0.001). B. A comparison of disease burden in BM and PB. This figure shows 24 cases with a BM positive for ALL, with a time point paired sample from PB. The X-axis displays disease burden in BM as a fraction of nucleated cells, calculated from MFC data. Triangles represent specimens for which NGS analysis of the equivalent PB specimen detected disease, and circles, those BM specimens for which NGS analysis of the concomitant PB specimen was negative for MRD. Of the nine samples with ALL detected in BM but not in PB, the levels of MRD are very low (~ 1:104) in eight cases, suggesting that PB may be able to supplement BM testing in patients with MRD.

