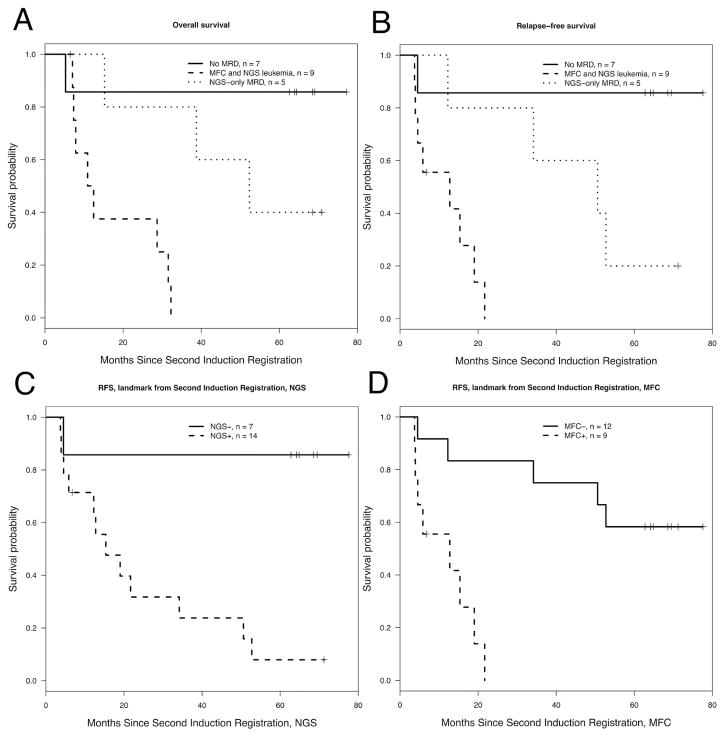
Figure 3. Survival by MRD status.
Panels A and B show OS and RFS according to MRD status at the time of registration to the protocol mandated second induction. The solid line shows survival for patients with MRD negative by MFC and NGS; ticked line shows survival for patients with MRD positive both by NGS an MFC; and dotted line shows survival for patients with MRD positive by NGS and negative by flow. Panels C and D illustrate RFS for patients with MRD negative (solid line) or positive (ticked line) by flow and NGS respectively.

