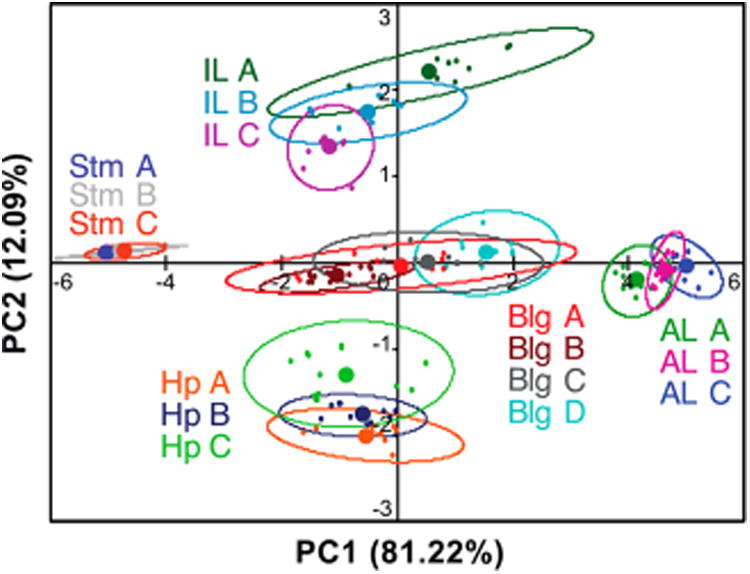
Figure 7.

PCA plot with individual RNA constructs separately labeled. Open ovals indicate 95% confidence intervals, while solid circles represent the centroid (average) positions. PC1 is generally proportional to size of secondary structure. The IL motifs are separated by purine/pyrimidine ratio on PC1 and PC2, and the Hp constructs are separated by both the size and the purine/pyrimidine ratio along PC2. See Figure 2 for sequences.
