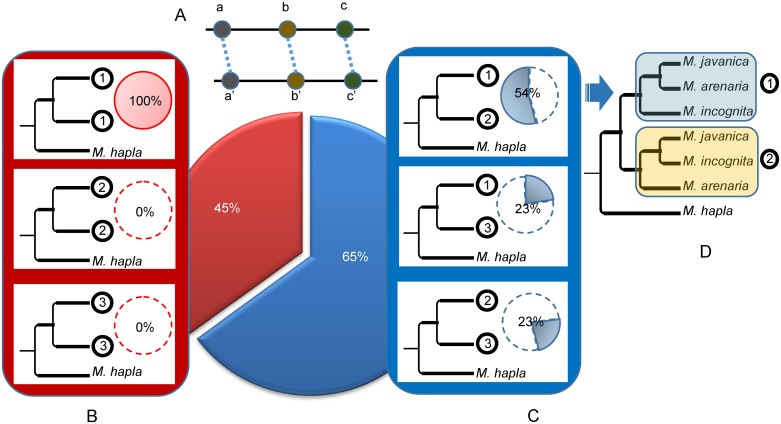
Fig 5. Combinations of topologies for duplicated regions in the three parthenogenetic Meloidogyne.
(A) Schematic representation of two duplicated regions each containing 3 collinear genes (a, b, c and a’, b’, c’). (B) ML trees combining twice the same topology among (1), (2) and (3), for the two duplicated regions (further detailed in Fig 4). These trees suggest the two duplicated regions have the same evolutionary history. (C) ML trees combining two different topologies for the duplicated regions. These trees suggest the two duplicated regions have different evolutionary histories. The relative frequencies of trees combining twice the same (red) or two different (blue) topologies are indicated in the big central pie chart. Relative frequencies within the red and blue categories are indicated by small pie charts next to the corresponding schematic tree. (D) The most frequently observed ML trees consist in a combination of topologies (1) and (2).

