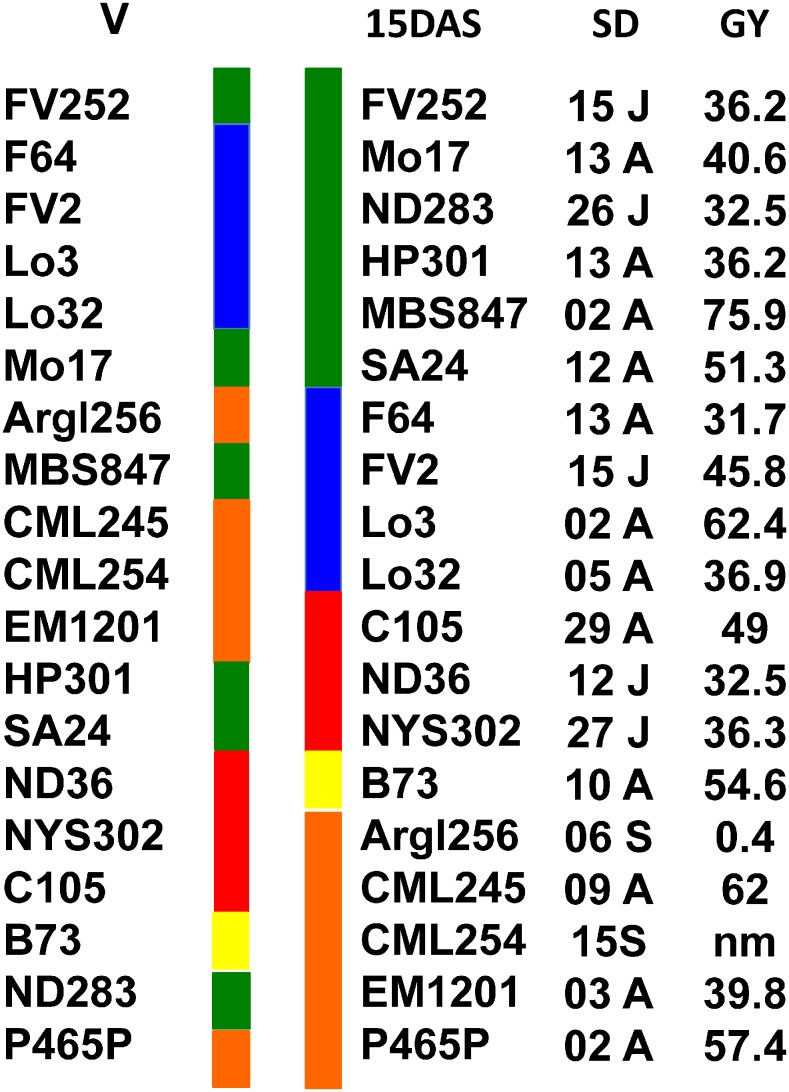
Figure 2.
Graphic Representation of the Relationships Existing between the Relative Amounts of Leaf Metabolites in 19 Lines of Maize Originating from Europe and America.
The metabolite content was measured by GC-MS analysis of young developing leaves at the vegetative stage (V) and of the leaves below the ear, 15 DAS, during the kernel-filling period. HCA was performed using the metabolome data presented in Supplemental Data Set 1. For each metabolite exhibiting a significant difference between the 19 lines (P ≤ 0.05), the ratio (content for each line/mean value of the 19 lines) was calculated and transformed into a log2 ratio before clustering analysis. The vertical green, blue, orange, red, and yellow boxes represent the five groups of maize lines in different countries of Europe and America (Tropical, orange; European Flint, blue; Northern Flint, red; Maize Belt Dent, green; Stiff Stalk, yellow). At the right of the panel, the silking dates are indicated (J = July, A = August, S = September), along with the grain yield (g−1 plant). Grain yield was determined for the 19 maize lines grown in the field (Supplemental Data Set 1). Compared with the others lines, the Tropical line Argl256 had a very low yield. It was also observed that the kernels of the other Tropical line, CML254, did not reach full maturity at the time of harvest (nm = not measured). Details of the HCA are presented in Supplemental Figure 3.

