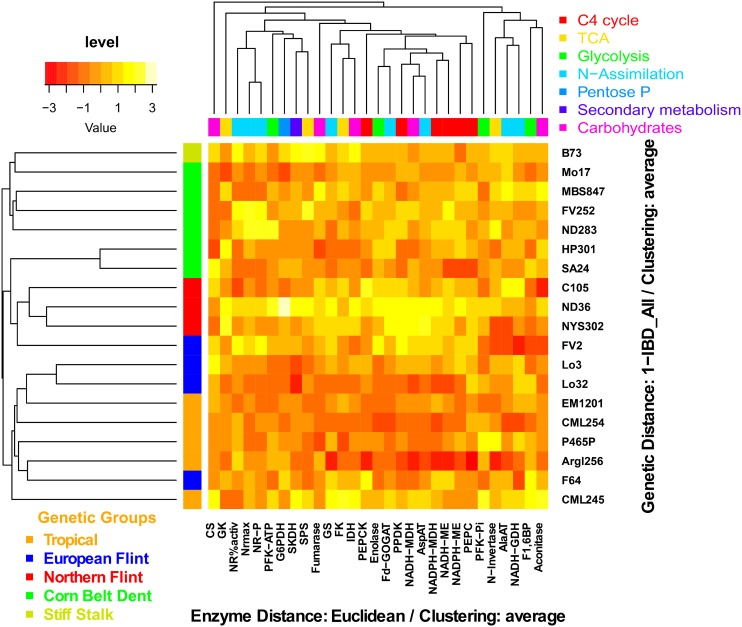
Figure 4.
Relationship between the Genetic Distance of the 19 Lines Originating from Europe and America and the Phenotypic Distance of Enzyme Activities.
Heat map showing the standardized level of enzyme activities of the 19 maize lines at 15 DAS. Two HCAs were performed to group the lines and the enzymatic pathways according to their genetic distances based on molecular markers (A_IBD) and according to their Euclidean phenotypic distance based on enzyme activities, respectively. At the left of the HCA, the vertical bar represents the five groups of maize lines (Tropical, orange; European Flint, blue; Northern Flint, red; Corn Belt Dent, green; Stiff Stalk, yellow). At the top of the HCA, colored bars represent the main classes of enzymes (C4 cycle, red; TCA, yellow; glycolysis, pale green; N-assimilation, turquoise; pentose-P, pale blue; secondary metabolism, dark blue; carbohydrate metabolism, purple). The top left scale represents the relative higher (yellow) or lower values (red) for enzyme activities compared with the median.

