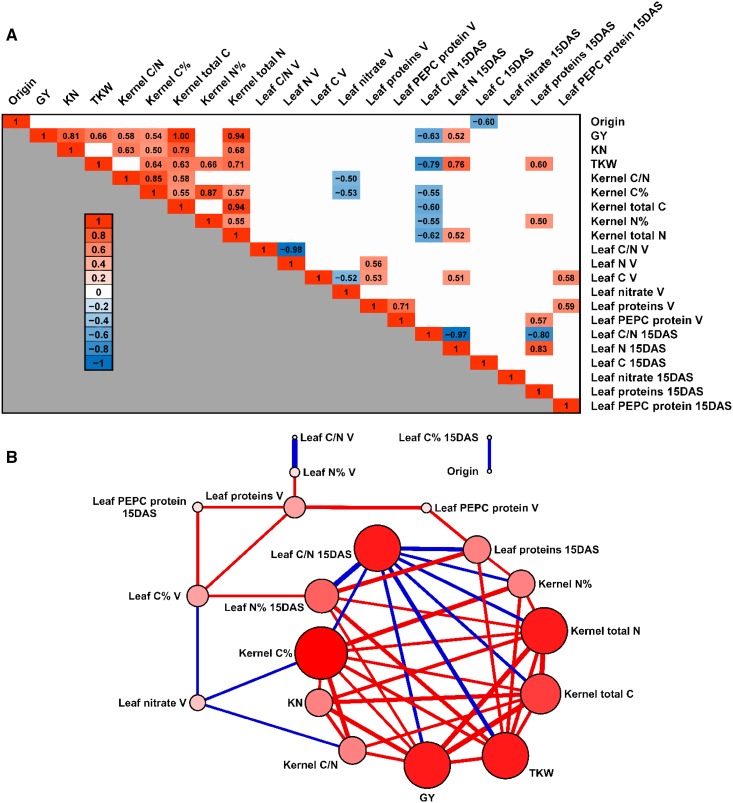
Figure 6.
Pearson Correlations between Agronomic and Physiological Traits Representative of the Leaf Physiological and Kernel Physiological Status of the 19 Maize Lines.
(A) Heat map showing the significant correlations (adjusted P values <0.05) found between kernel yield traits (GY, KN, and TKW) and key parameters representative of the kernel and leaf physiological status (C = carbon, N = nitrogen, C/N ratio, leaf soluble protein, PEPC protein, and nitrate contents). The negative and positive correlation coefficient values are indicated in each colored box of the heat map using the scale on the left side of the panel.
(B) Network diagram illustrating the most significant correlations found between agronomic and physiological traits. Traits with a higher number of correlations are represented by larger and darker red dots. Thicker and red lines represent the highest positive correlations. Thicker and blue lines represent the highest negative correlations.

