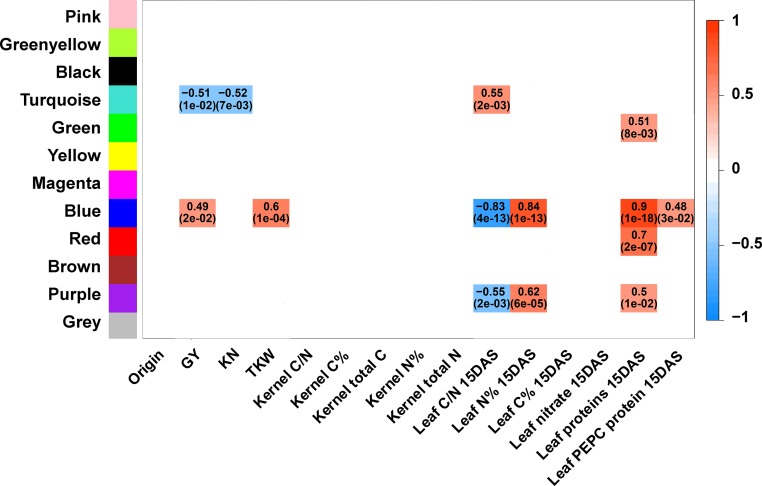
Figure 7.
Heat Map and Pearson Correlations with the Modules and Agronomic Traits (GY, KN, and TKW) and Physiological Parameters Representative of the Kernel and Leaf Physiological Status 15 DAS.
Correlations with the modules containing the generic physiological traits 15 DAS. The color names correspond to the 12 modules that were obtained from the 15 DAS metabolite and enzyme activity data set network analyses (Supplemental Data Set 10). Heat map and Pearson correlations between modules and kernel yield traits (GY, KN, and TKW) and key parameters representative of the kernel and leaf physiological status (C = carbon, N = nitrogen, C/N ratio, leaf soluble protein, PEPC protein, and nitrate contents). Correlations were considered significant with Bonferroni adjusted P values <0.05. Adjusted P values are shown in parentheses. Only significant negative and positive correlation coefficient values are indicated in each colored box. For clarity, only those with a correlation higher than 0.4 have been considered. The box of the heat map using the scale on the right side of the panel. e = exponent base 10. The same analysis was performed at the V stage (Supplemental Figure 8).

