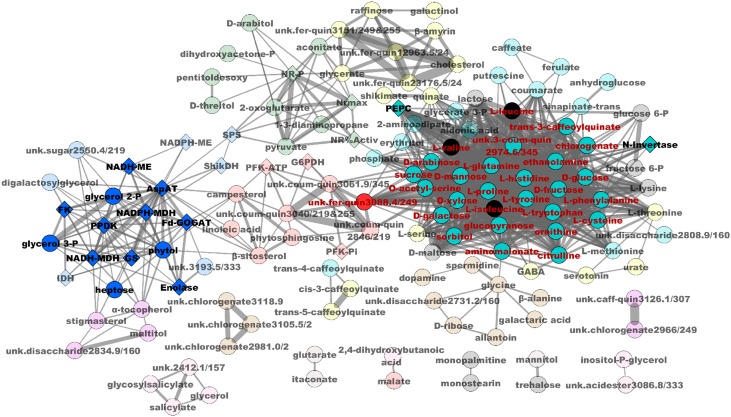
Figure 8.
Network Diagram for Relationships between Leaf Metabolites and Enzyme Activities 15 DAS.
Diamonds represent enzymes, and circles represent metabolites. Colors of the circles and diamonds correspond to the different components within a module. The names of metabolites and enzymes positively or negatively correlated with GY are highlighted in bold black and in red characters, respectively. Only the network connections that have a topological overlap above the threshold of 0.1 are shown. The red circle in the center corresponds to a metabolite of unknown function (unk. Fer-quin 3088.4/249) with a structure similar to a feruloylquinate that exhibits a significant negative correlation with GY. Lines represent a significant correlation between two traits. Thicker lines represent the highest positive or negative correlations. The same analysis was performed at 15 DAS for correlations with TKW (Supplemental Figure 9).

