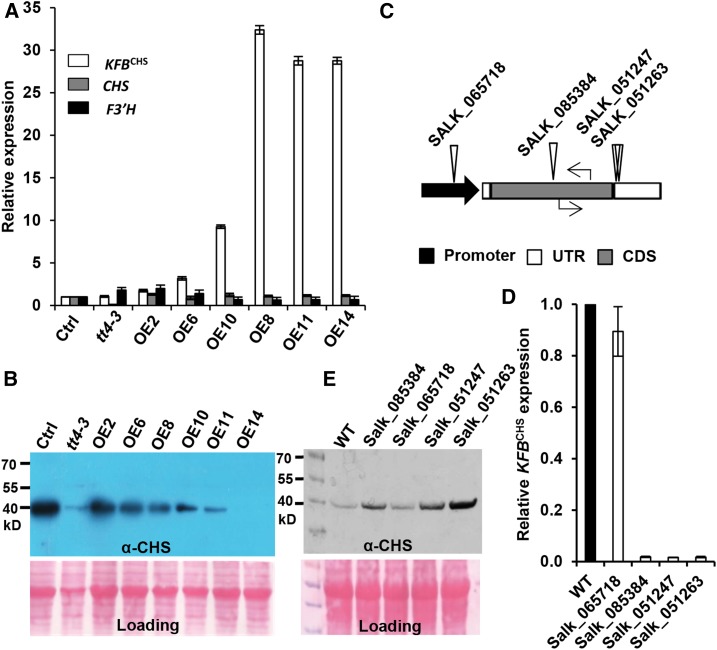
Figure 3.
Disturbing KFBCHS Expression Alters CHS Cellular Concentration in Arabidopsis Seedlings.
The plants were grown under white light with a fluence rate of 104 ± 5 µmol·m−2·s−1 and a 16-h-light/8-h-night regime at 22°C.
(A) The relative expression levels of KFBCHS, CHS, and F3′H in the independent T2 KFBCHS overexpression (OEs), the empty vector control (Ctrl.), and tt4-3 (CS66119) mutant lines, detected by RT-qPCR. Total RNA was extracted from the mixed 5-DAG agar plate-grown seedlings. Data represent means ± sd of three biological replicates; each replicate represents the mixed seedlings (0.1 g FW) from one agar plate. The expression level of each gene in the empty vector control lines was set as “1.”
(B) Immunoblot of CHS protein probed with anti-AtCHS antibody in the KFBCHS overexpression, the empty vector control, and the tt4-3 mutant lines from the same set of materials as in (A). Total protein stained with Ponceau S serves as the loading controls.
(C) Diagram of T-DNA insertion mutations (triangles) of KFBCHS gene, and the positions of RT-qPCR primers (arrows) used for detecting gene expression. Black arrow represents the promoter region; empty bars represent untranslated regions; gray bar represents coding sequence. No intron exists in the KFBCHS gene.
(D) The expression levels of KFBCHS in T-DNA insertion mutant lines, detected by RT-qPCR. The expression level in the wild type was set as “1.” Data represent means ± sd of three biological replicates; and each replicate represents the pooled seedlings (0.1 g FW) from one agar plate.
(E) Immunoblot detection of CHS protein in kfbchs homozygous mutant lines. An equal amount of total proteins (10 µg) from 5-DAG seedlings of each line was developed by 12% SDS-PAGE gel and transferred to nitrocellulose membrane. CHS was detected using anti-AtCHS antibody. Ponceau S staining serves as the loading control for the amount of total protein.

