Figure 2.
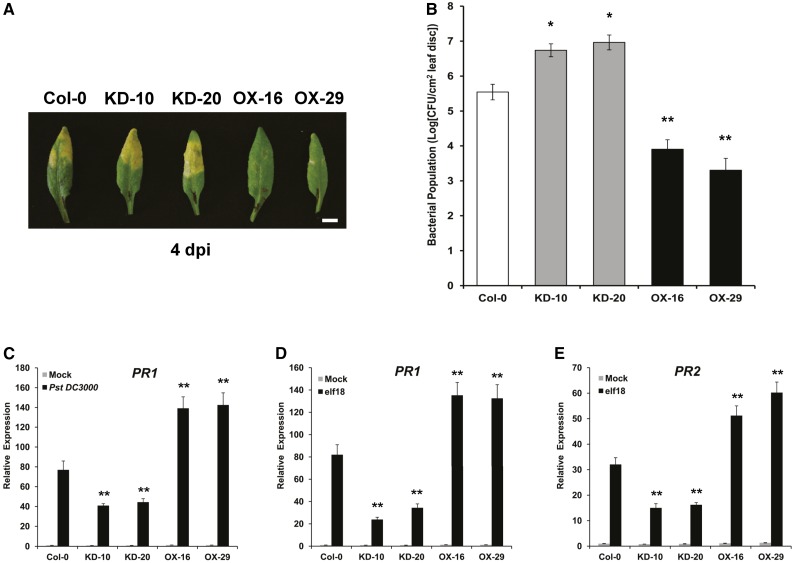
Defense Phenotypes of ELENA1 KD and OX Plants.
(A) Altered disease susceptibility of plants of various genotypes. Wild-type (left end), ELENA1 KD lines (#10 and #20), and ELENA1 OX lines (#16 and #29) were inoculated with Pst DC3000. Infected leaves were photographed at 4 d postinoculation (dpi). Bar = 5 mm.
(B) Growth of Pst DC3000 in plants of various genotypes. Wild-type, KD lines, and OX lines were inoculated with Pst DC3000 and bacterial population in each was determined at 4 d postinoculation. Bars indicate ± sd (n = 3). CFU, colony-forming units.
(C) Using qRT-PCR, PR1 mRNA levels were determined in ELENA1 transgenic plants at 24 h after infiltration with Pst DC3000. Infiltration with water (gray bars) served as the mock control. All experiments were performed using 4- to 5-week-old leaf tissues and repeated at least three times with similar results.
(D) Real-time PCR analysis of PR1 expression in the absence or presence of 5 µM elf18 for 24 h.
(E) Real-time PCR analysis of PR2 expression in the absence or presence of 5 µM elf18 for 24 h.
For (C) to (E), transcript levels were normalized to ACT2 expression levels. Bars represent average ± sd (n = 3). For (B) to (E), asterisks indicate statistically significant difference compared with the wild type (Col-0). *P < 0.05 and **P < 0.01; two-tailed t test.

