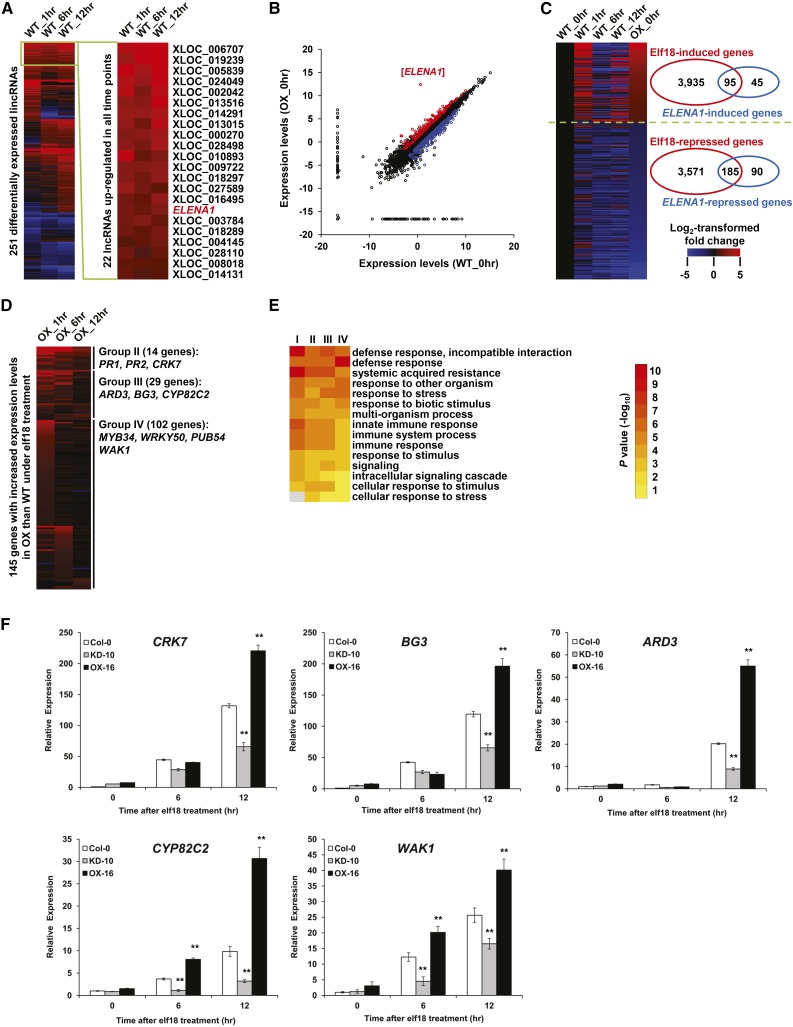
Figure 4.
Transcriptional Regulation of elf18-Responsive Genes by ELENA1.
(A) Heat map showing fold changes of 251 differentially expressed lncRNAs under 5 µM elf18 treatment compared with normal condition (fold change ≥ 2 or ≤ 0.5, P value < 0.05). Twenty-two lncRNAs that were upregulated in all time points are selectively shown on the right.
(B) Scatterplot showing log2-transformed expression levels (FPKMs) of expressed genes in the wild type (x axis) compared with OX-16 plant (y axis).
(C) Heat map showing fold changes of 280 elf18-responsive genes with altered basal expression levels in OX plants.
(D) Heat map showing fold changes of 145 genes with increased expression levels in OX compared with wild-type plants under elf18 treatment.
(E) GO enrichment analysis of Group I, II, III, and IV genes. Top 15 (with the lowest P values) enriched GO terms of the biological process category are shown.
(F) Time-course analysis of selected target gene expression after elf18 treatment. Transcript levels were normalized to ACT2 expression levels. Bars represent average ± sd (n = 3 independent seedling pools). Asterisks indicate statistically significant difference compared with the wild type (Col-0). **P < 0.01; two-tailed t test.

