Figure 3.
Characterization of Rice GCN5 and ADA2 RNAi Lines.
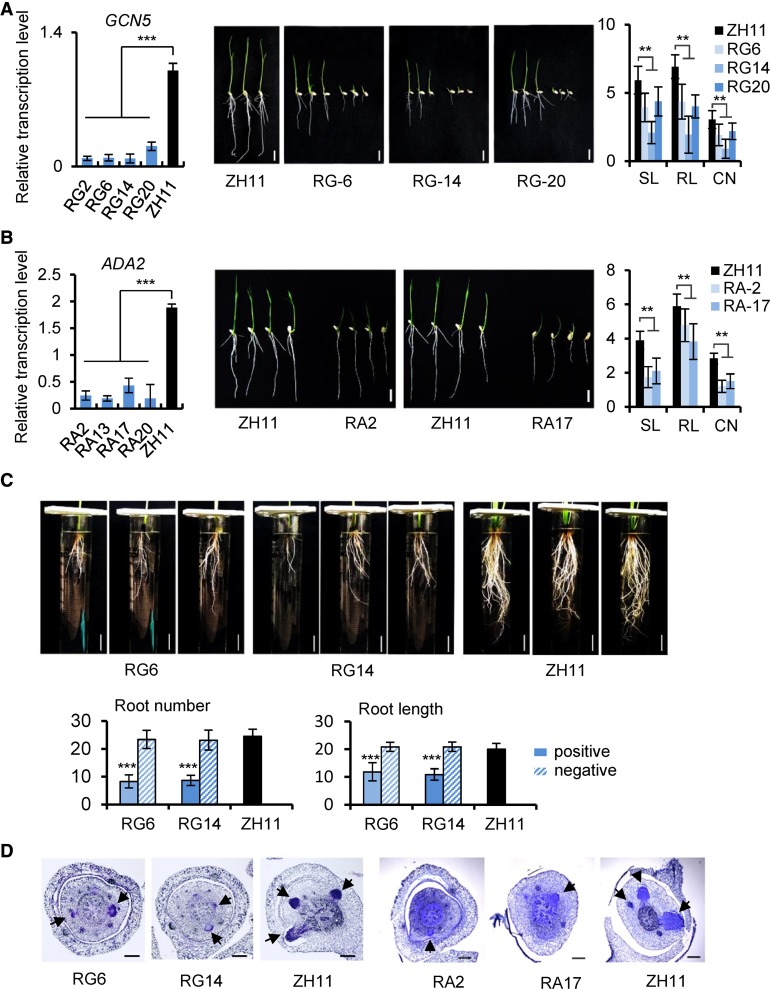
(A) and (B) GCN5 (A) and ADA2 (B) RNAi lines. Left, transcripts in four transgenic RNAi lines and the wild type. Values are relative to ACTIN1 transcripts. Bars represent means ± sd from three biological replicates. Each replicate was performed with independent mRNA extractions from different 10-d-old seedlings for each genotype. Significant differences calculated from the three biological replicates are indicated by triple asterisks (P value < 0.001). Middle, 7-d-old seedling phenotype; bars = 1 cm. Right, shoot (SL) and root (RL) lengths, and crown root number (CN) of the RNAi lines compared with the wild type (ZH11). Data are from three GCN5 or ADA2 RNAi lines. Bars are means ± sd of 30 plants. Significant difference between transgenic lines and the wild type (Student’s t tests, P value < 0.01) are marked by double asterisks.
(C) Upper panels: Comparison of root number and length of 45-d-old hydroponic GCN5 RNAi lines and the wild type. Bars = 3 cm. Lower panels: Statistical data of root numbers and root lengths of RG6 and RG14 positive and negative (without the transgene) segregants from T3 generation and wild-type plants. Error bars of histogram denote ± sd of 12 plants. Significant difference between the positive RNAi lines and the wild type (Student’s t tests, P value < 0.001) was marked by triple asterisks.
(D) Toluidine blue-stained cross sections of coleoptilar nodes of GCN5 (3 d old) and ADA2 (5 d old) RNAi lines and corresponding wild type. Arrows indicate emerging crown root initials. Bar = 100 μm.

