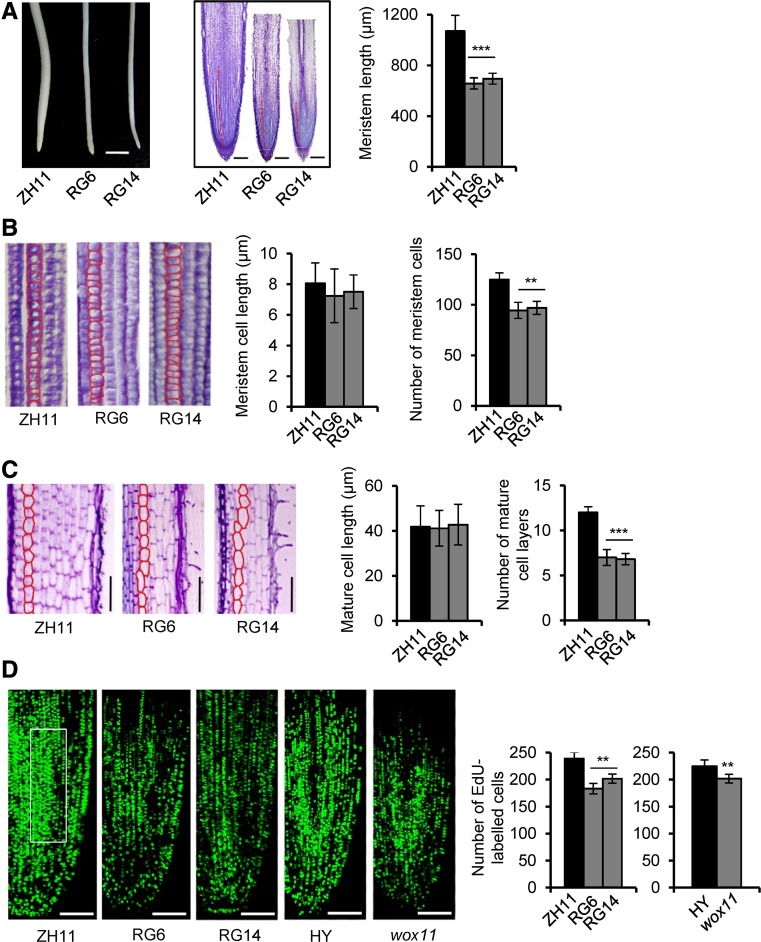
Figure 4.
GCN5 RNAi Lines Have a Reduced Rice Crown Root Meristem Cell Division Rate.
(A) Root phenotype of GCN5 RNAi lines and the wild type (ZH11). Left: GCN5 RNAi lines show smaller root tips. Bars = 3 mm. Middle: Median longitudinal sections through root tips of GCN5 RNAi and the wild type; red lines delimit the meristem size (from the quiescent center to the transition zone). Bars = 200 μm. Right: Statistical data for meristem lengths from two RNAi lines (RG6 and RG14) and the wild type. Bars represent means ± sd of 10 roots. Significant differences between transgenic lines and the wild type (Student’s t test, P value < 0.001) are marked by triple asterisks.
(B) Cell size and number within the same length of root meristem cell files of GCN5 RNAi and the wild type. Statistical data for meristem cell length and number from each material are shown on the right. Bars show means ± sd of 10 roots. Significant differences with P < 0.01 (Student’s t tests) between RNAi and the wild type are marked by two asterisks.
(C) Cell size and layer number in the differentiated zone of GCN5 RNAi and wild-type roots. Bars = 100 μm. Statistical analysis showed significant difference (Student’s t test, P < 0.001) between the RNAi lines and the wild type. Bars show means ± sd.
(D) Longitudinal view of EdU-labeled cells in the 4-d-old seedling root meristems of GCN5 RNAi and its wild type (ZH11), or wox11 mutant and its wild type (HY). Bars = 100 μm. Numbers of EdU-labeled cells in an arbitrary area of root tip (white box) were counted. Error bars show means ± sd of five roots. Significant differences between the knockdown/knockout lines and the corresponding wild type are indicated by double asterisks (Student’s t test P value<0.01).

