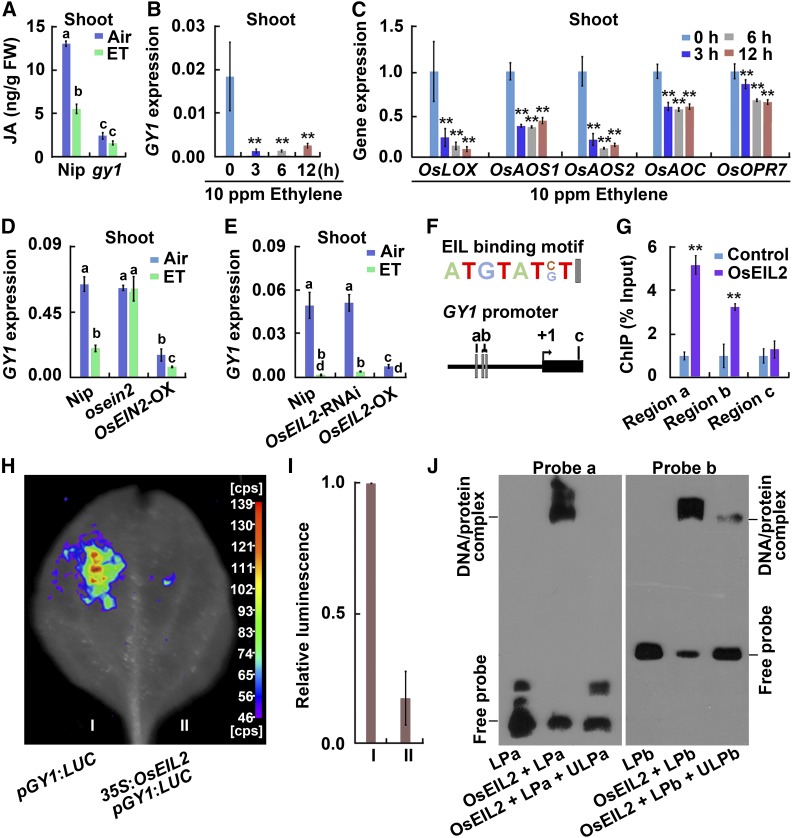
Figure 5.
Ethylene Inhibits GY1 Expression through OsEIL2.
(A) JA content in etiolated seedlings from Nip and gy1 grown for 3 d after germination in darkness. ET indicates 10 ppm ethylene treatment for 8 h. The values are means ± sd of three biological replicates (independent pools of tissue) per sample. Different letters above each column indicate significant difference between the compared pairs (P < 0.05, Student’s t test).
(B) GY1 expression in shoots of Nip etiolated seedlings after 10 ppm ethylene treatment for 8 h. The quantitation was performed by qPCR relative to OsActin2 expression. The values are means ± sd of three biological replicates (independent pools of tissue) per sample. The asterisks indicate significant difference compared with the “0 h” value (**P < 0.01, Student’s t test).
(C) Expression of OsLOX, OsAOS1, OsAOS2, OsAOC, and OsOPR7 from the JA biosynthesis pathway in shoots of etiolated Nip seedlings. The seedlings were treated with 10 ppm ethylene for 8 h, and the quantitation was performed by qPCR relative to OsActin2 expression. The expression level of each gene at the “0 h” treatment was set to 1 and other values were compared with it. The values are means ± sd of three biological replicates (independent pools of tissue) per sample. The asterisks indicate significant difference compared with the “0 h” value (**P < 0.01, Student’s t test).
(D) GY1 expression level in the shoots of Nip, mhz7/osein2, and MHZ7/OsEIN2-OX etiolated seedlings after treatment with 10 ppm ethylene (ET) for 8 h. The quantitation was performed by qPCR relative to OsActin2 expression. The values are means ± sd of three biological replicates (independent pools of tissue) per sample. Different letters above each column indicate significant difference between the compared pairs (P < 0.05, Student’s t test).
(E) GY1 expression in etiolated seedlings from Nip, OsEIL2-RNAi, and OsEIL2-OX after 10 ppm ethylene treatment for 8 h. Other indications are as in (D).
(F) The EIL binding motif in the GY1 promoter region. a, b, and c indicate regions examined by ChIP-PCR in (G). a and b also indicate probe a and probe b used in (J), respectively.
(G) Enrichment fold of the ChIP-PCR signals from the regions shown in (F). The ChIP analysis was performed with the wild-type Nip (Control) and 35S:OsEIL2:GFP (OsEIL2) transgenic plants. Error bars indicate ± sd from three biological repeats (independent pools of tissue). Asterisks indicate that the difference between OsEIL2 value and control value is significant (P < 0.01, Student’s t test).
(H) OsEIL2 represses the promoter activity of GY1 in a transient expression assay in tobacco leaves. 35S:OsEIL2 was used as an effector plasmid and pGY1:LUC as a reporter plasmid harboring the GY1 promoter-driven LUC. More than five biological replicates (independent pools of tissue) were performed with similar results.
(I) Quantitative analysis of luminescence intensity in samples from (G). The values are means ± sd of four biological replicates (independent pools of tissue). The asterisks indicate significant difference compared with the control (**P < 0.01, Student’s t test).
(J) OsEIL2 protein binds to the promoter region of GY1 containing the EIL binding site. GST-tagged OsEIL2 N terminus fusion protein (OsEIL2) was incubated with biotin-labeled DNA fragments (probe a and probe b), respectively. An excess of unlabeled probe (competitor) was also added to compete with the biotin-labeled promoter region for OsEIL2 binding. LPa indicates labeled probe a. ULPa indicates unlabeled probe a. LPb indicates labeled probe b. ULPb indicates unlabeled probe b. The upper bands are labeled probes bound with OsEIL2 protein.

