Figure 6.
Genetic Interaction of GY1 with OsEIN2.
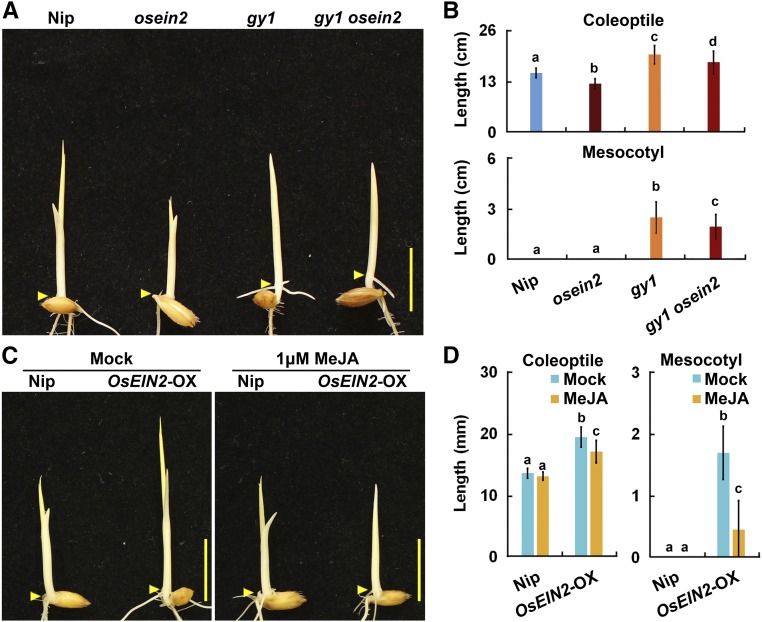
(A) Etiolated Nip, gy1, osein2, and the gy1 osein2 double mutant seedlings grown for 3 d after germination in darkness. Arrowheads indicate the coleoptilar nodes between the mesocotyl and coleoptile. Bar = 10 mm.
(B) Coleoptile and mesocotyl length of etiolated Nip, gy1, osein2, and gy1 osein2 double mutant seedlings grown for 3 d after germination in darkness. The values are means ± sd of 20 to 30 seedlings per sample. Different letters above each column indicate significant difference between the compared pairs (P < 0.05, Student’s t test).
(C) Etiolated seedlings from Nip and MHZ7/OsEIN2-OX without (mock) or with 1 μM MeJA treatment grown for 3 d after germination in darkness. Arrowheads indicate the coleoptilar nodes between the mesocotyl and coleoptile. Bar = 10 mm.
(D) Coleoptile and mesocotyl length of etiolated seedlings from Nip and MHZ7/OsEIN2-OX without (mock) or with 1 μM MeJA treatment grown for 3 d after germination in darkness. The values are means ± sd of 20 to 30 seedlings per sample. Different letters above each column indicate significant difference between the compared pairs (P < 0.05, Student’s t test).

