
Figure 4. – Low-dose IPI-145 monotherapy in vivo partially reverses MDSC suppressive capacity and enhances CD8 TIL infiltration and activation in MOC1 tumor-bearing mice.
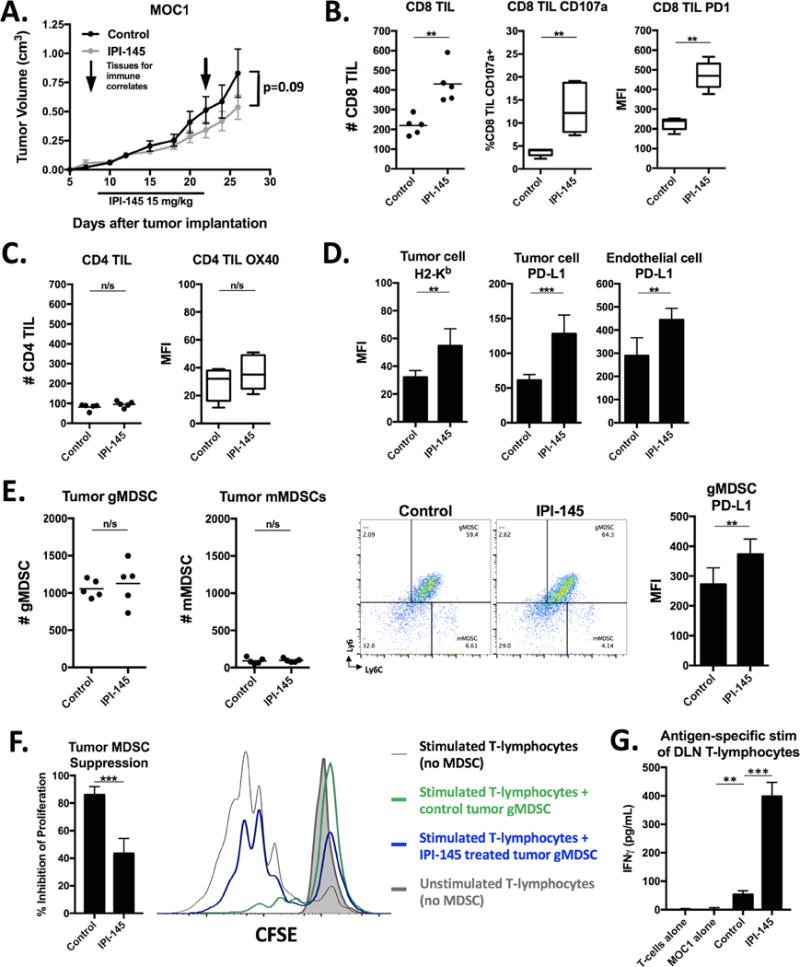
A, mice bearing palpable MOC1 tumors were treated with 15 mg/kg IPI-145 for 14 days (n=8–10 mice/group). Tissues were analyzed for immune correlates on the last day of treatment (n=5 mice/group). All immune infiltrate data represented as absolute number of infiltrating cells per 1×10⁴ live cells collected. Tumor single cell suspensions were analyzed for CD8 TIL (B) and CD4 TIL (C) infiltration and activation markers via flow cytometry. Cells shown are 7AAD−CD45.2+CD3+. D, expression of H2-Kb and PD-L1 was measured on tumor cells (CD45.2−CD31−) or endothelial cells (CD45.2−CD31+) via flow cytometry. E, quantification (left panels) and representative dot plots (right panels) of tumor infiltrating MDSCs measured from tumor single cell suspensions via flow cytometry. MFI of gMDSC PD-L1 expression quantified. F, tumor gMDSCs were sorted and assessed for their ability to suppress T-lymphocyte proliferation at 72 hours (quantified on the left, overlaid CFSE histograms on right). G, T-lymphocytes were isolated from tumor draining lymph nodes, pooled, and stimulated with IFNγ (20 ng/mL) pretreated and irradiated (50 Gy) MOC1 cells for 48 hours. IFNγ levels quantified by ELISA. **, p<0.01; ***, p<0.001. n/s, non-significant.