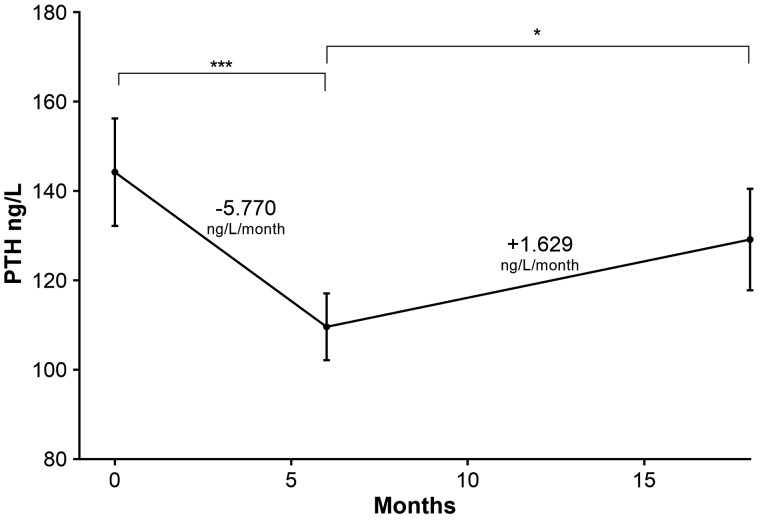
Fig. 3.
PTH status in RTRs at baseline compared with repletion-end and post-repletion. PTH varied markedly with VitD repletion. End of repletion PTH (mean 109.6 ng/L) is significantly reduced compared with baseline PTH (mean 144.2 ng/L, P < 0.001). Post-repletion PTH (mean 129.2 ng/L) is significantly greater than repletion end PTH (P = 0.046), but not different from baseline (P = 0.191). Repletion gradient = 5.770 ng/L/month and post-repletion = 1.629 ng/L/month. *P < 0.05, ***P < 0.0001.

