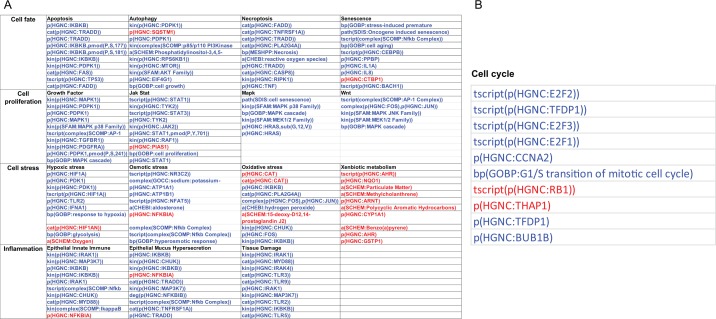
Figure 2.
Leading node analysis of the network perturbation in (A) current smoker and (B) former smoker nasal epithelium. While the network perturbation amplitude is without direction, the leading node analysis reveals the directionality of the backbone score. The top 10 leading nodes in A and B are represented in Biological Expression Language (BEL); the vocabulary for BEL is provided in http://www.openbel.org/. The directionalities of regulation are shown as red (up) and blue (down) and the order indicates the relative contribution to the score.

