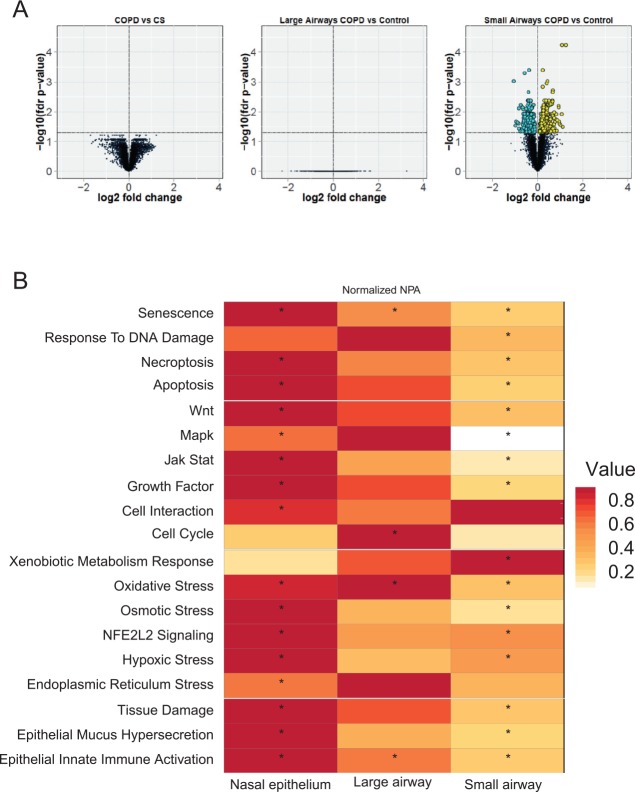
Figure 3.
Impact of COPD on the nasal and the respiratory tract epithelium. (A) Volcano plots representing the differentially expressed genes extracted from each data set. For each gene, the gene expression change, calculated as the log2 fold-change, is plotted on the x-axis and the statistical significance, proportional to the negative log10-adjusted P value, is plotted on the y-axis. Yellow and cyan dots highlight genes that are statistically significantly upregulated and downregulated, respectively (FDR-adjusted P < .05). (B) Heatmap comparing the impact on each network across the comparisons (COPD vs current smoker at different levels of the respiratory tract). The color gradient of the network perturbation amplitude score is normalized to the maximum score per network. Only the network models that show a significant impact for at least one comparison are shown. A network is considered significantly perturbed if the network perturbation amplitude score remains significant after accounting for the experimental variation and if the companion statistics O and K are significant (P < .05). The O and K statistics indicate the specificity of the score to the biology represented by each network. *Significant network perturbation amplitude score with respect to the experimental variation and with significant O and K statistics. COPD indicates chronic obstructive pulmonary disease; CS: current smoker; FDR: false discovery rate.

