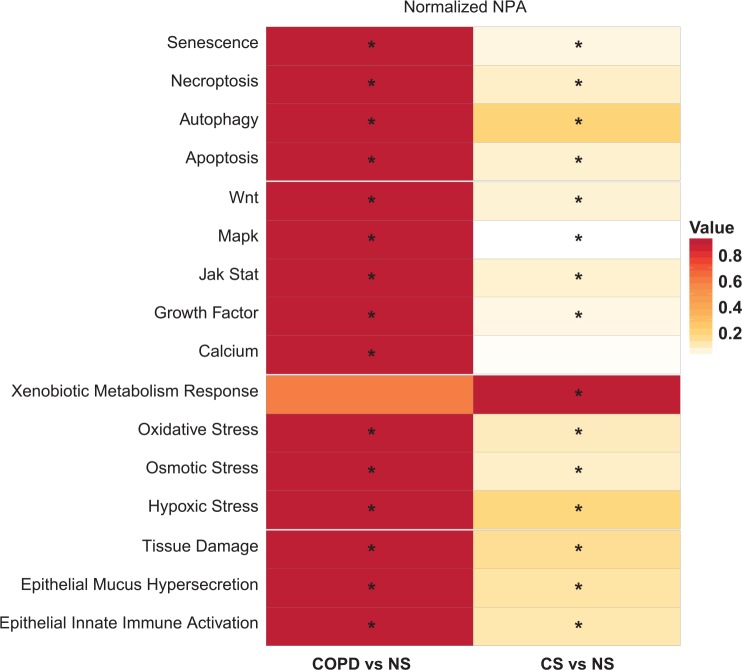
Figure 5.
Impact of smoking and COPD on the nasal epithelium compared with nonsmoker nasal epithelium. The heatmap shows all the networks that were perturbed in the nasal epithelium of COPD subjects or current smokers compared with never-smokers. The color gradient of the network perturbation amplitude score is normalized to the maximum score per network. Only the network models that show a significant impact for at least one comparison are shown. A network is considered significantly perturbed if the score remains significant after accounting for the experimental variation and if the companion statistics O and K are significant (P < .05). The O and K statistics indicate the specificity of the network perturbation amplitude score to the biology represented by each network. *Significant NPA score with respect to the experimental variation and with significant O and K statistics. COPD indicates chronic obstructive pulmonary disease; CS: current smoker; NPA: network perturbation amplitude; NS: never-smoker.

