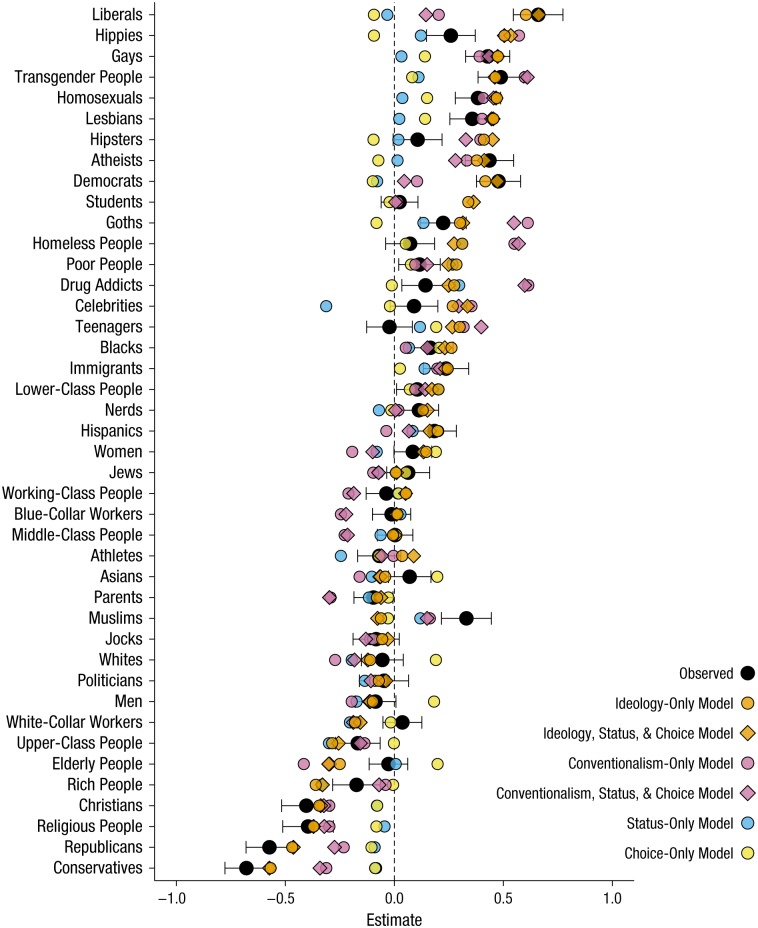
Fig. 2.
Comparison of the predicted and observed estimates for the association between ideology and prejudice toward the target groups in Study 4. The observed estimates were obtained using ordinary least squares regression, adjusting for age, gender, education, income, and race-ethnicity. The predicted estimates were obtained from the models described in Table 1. The dashed vertical line represents the predictions of the null model. All variables were coded to have a range of 1. Error bars represent 95% confidence intervals. The target groups are ordered from the group perceived as most liberal (top) to the group perceived as most conservative (bottom).

