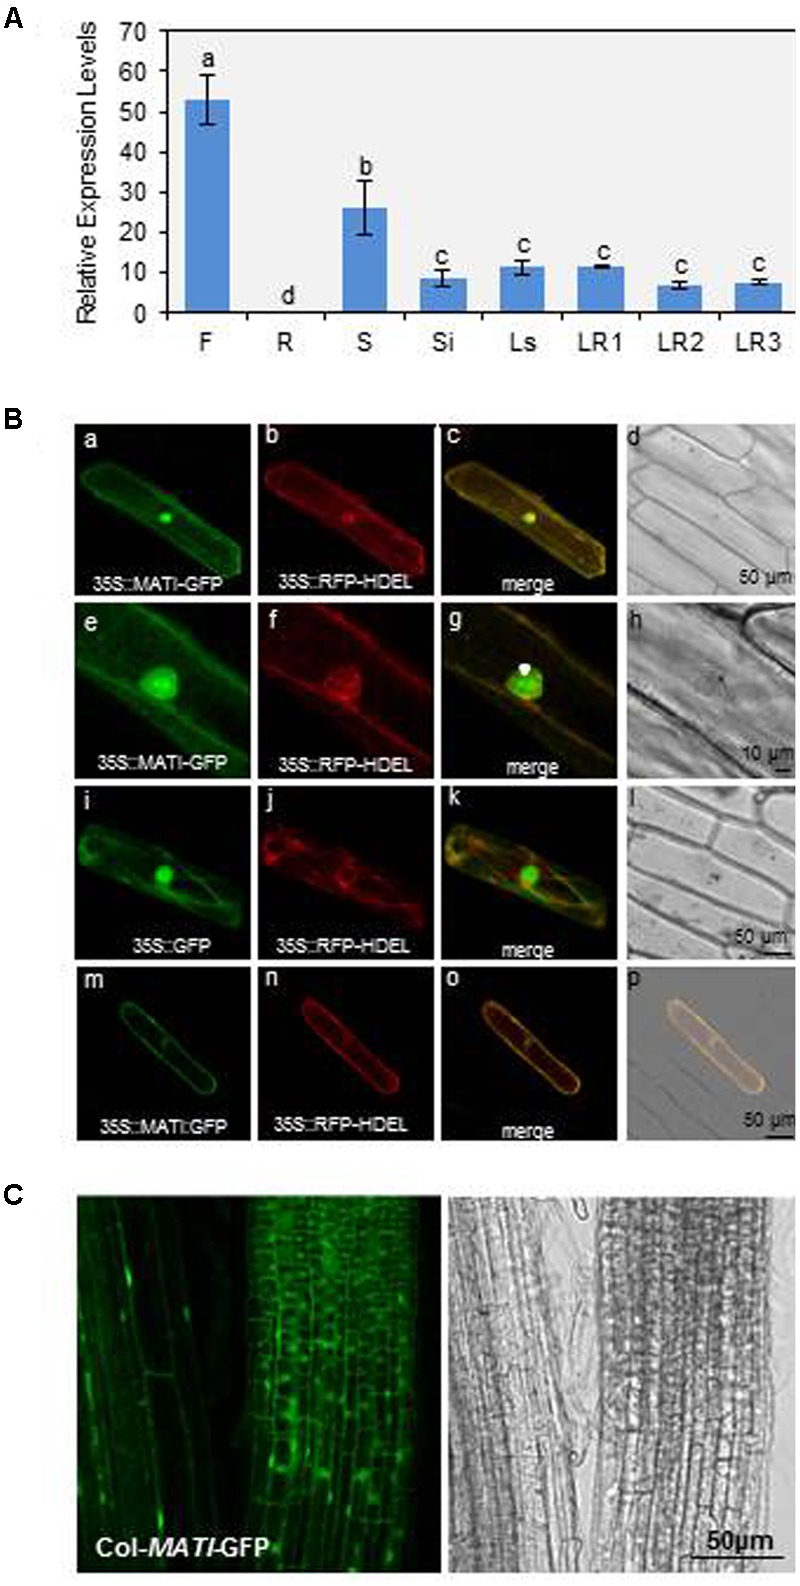
FIGURE 3.

Mite Attack Triggered Immunity gene expression in plant tissues and protein subcellular location. (A) Relative gene expression levels (2-ΔCt) of MATI gene in different Arabidopsis tissues. Flowers (F), roots (R), seeds (S), siliques (Si), leaves from stem (Ls) and from rosettes at 1- to 3-week-old (LR1, LR2, and LR3). Data are means ± SE of three replicates. Different letters indicate significant differences (P < 0.05, One-way ANOVA followed by Student-Newman-Keuls test). (B) Confocal stacks spanning epidermal onion cells co-transformed with 35S-MATI-GFP, 35S-GFP control and/or 35S-RFP-HDEL control. Confocal projections from green fluorescent protein (GFP) (a,e,i), RFP (b,f,j), merged (c,g,k), and the corresponding Nomarski snapshots (d,h,l). Confocal images (m,n) and projections (o,p) of the MATI localization after plasmolysis with 1 M mannitol are shown. (C) Subcellular location of MATI protein in roots from transgenic Col-MATI-GFP lines. Observations with a Nomarski bright field are also shown (right panel). Bars are as indicated in all images.
