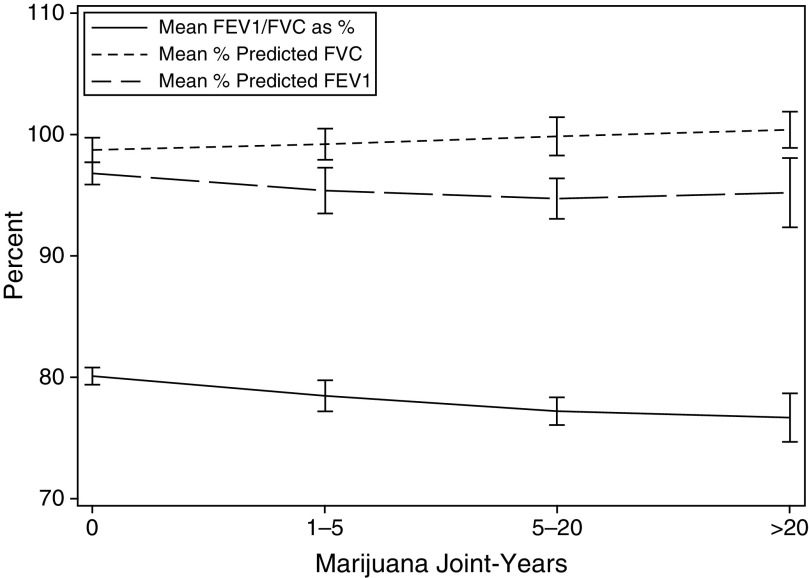
Figure 2.
Change in spirometric values by cumulative lifetime marijuana use among adult participants in the 2009–2010 National Health and Nutrition Examination Survey. Among participants reporting a joint-year usage of 0, 1–5, 6–20, or greater than 20 years, mean percent predicted FEV1s were 96.8% (95% confidence interval [CI] = 95.9–97.7), 95.4% (95% CI = 93.5–97.2), 94.7% (95% CI = 93.0–96.4), and 95.2% (95% CI = 92.3–98.0), respectively. Among these same groups, mean percent predicted FVCs were 98.7% (95% CI = 97.6–99.7), 99.2% (95% CI = 97.9–100.4), 99.8% (95% CI = 98.3–101.4), and 100.3% (95% CI = 98.8–101.8), respectively. Of these groups, mean FEV1/FVC ratios were 0.80 (95% CI = 0.79–0.81), 0.78 (95% CI = 0.77–0.80), 0.77 (95% CI = 0.76–0.78), and 0.77 (95% CI = 0.75–0.79), respectively.

