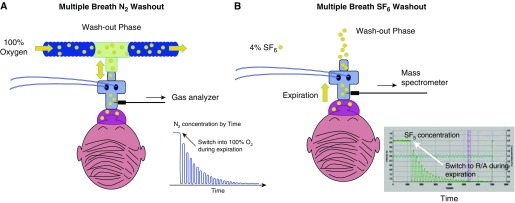
Figure 1.
Schematic representation of two washout phase tests using the two techniques. (A) N2-based setup. During the N2 washout, 100% oxygen is delivered using a bias flow. The blue tracing shows the decay in the N2 signal during expiration. (B) Extrinsic gas, SF6-based setup. The green tracing shows the decay in the SF6 concentration during the washout-phase. R/A = room air.

