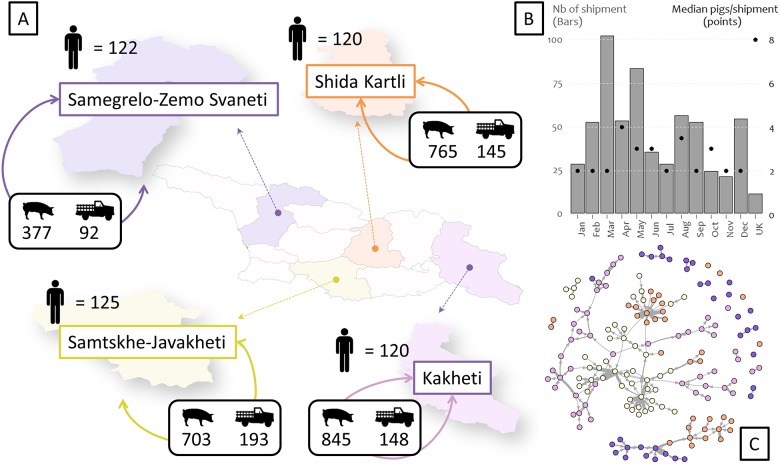
Fig 1. A: Number of farmers (n = 487) interviewed per region (n = 4), number of pigs shipped and number of shipments within region in Georgia, as reported by farmers during a 12 months’ scope questionnaire; B: Monthly frequency of shipments (bars) and median number of pigs transported per shipment (dots), C: Network visualization.
Colors of the regions in the map correspond to colors of the network. UK = Unknown; Pig image = Total number of pigs shipped within region; Truck image = Total number of shipments within region.

