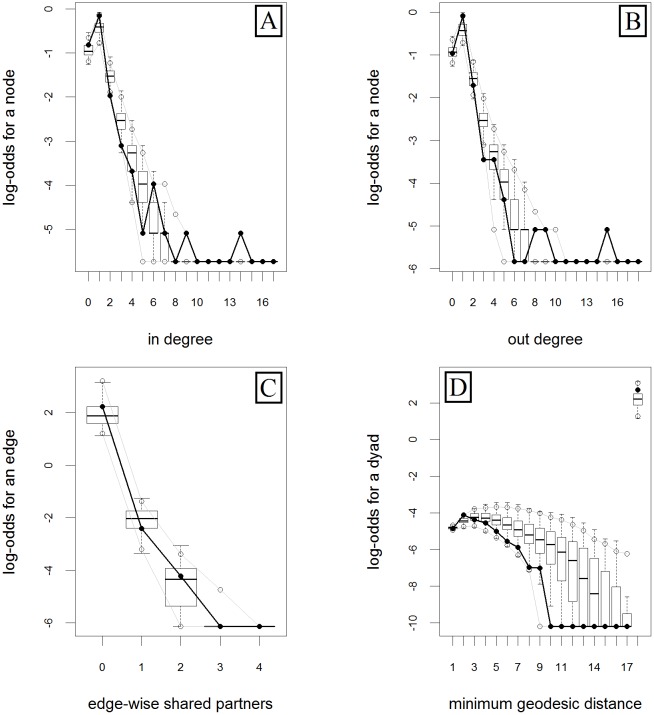
Fig 3. Frequency distribution of the studied goodness of fit diagnostic parameters of the m2 (final) exponential random graph model of the swine trade industry in Georgia, during a twelve-month period.
Black lines represent the observed data. Boxplots cover the values of 100 randomly-simulated networks that conform to the model; whiskers represent the 95% CI.

