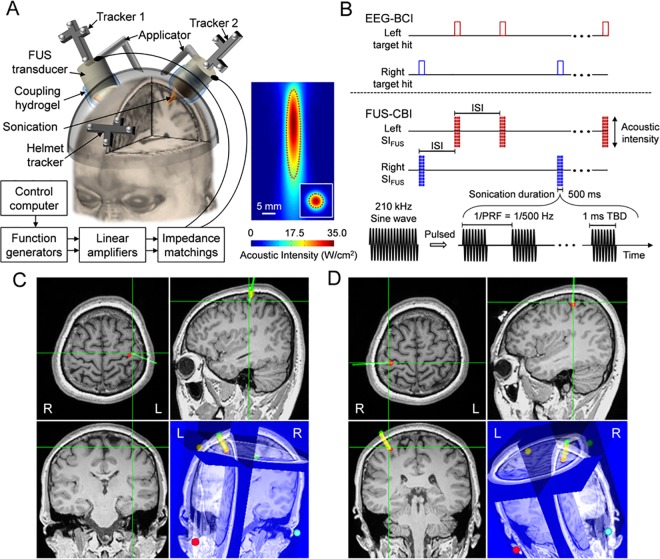
Fig 3. Schematics for the FUS-mediated CBI system in BBI communication.
(A) Left panel: a rendering of the FUS setup for the CBI segment. The left and right SI were independently targeted by two single-element 210 kHz FUS transducers where the locations of FUS foci were tracked by using the optical trackers (‘tracker 1’ and ‘tracker 2’) in reference to the head (tracked via ‘helmet tracker’). Each tracker having four infrared-reflective markers was recognized by a motion capture camera. The gap between the transducer and the scalp was filled with a soft compressible hydrogel for the acoustic coupling. FUS transducers were actuated by separate sets of computer-controlled driving circuits. Right panel: The acoustic intensity mapping of the FUS transducer. The FWHM of the intensity profile is demarcated by red dotted lines. (B) Illustration of the FUS actuations triggered by the transmitted signals from the BCI segment with the following acoustic parameters: SD = 500 ms; ISI, inter-stimulation-interval, = 7 s; TBD = 1 ms; PRF = 500 Hz; Isppa = 35.0 W/cm2. (C and D) Exemplar views of the FUS targeting to the bilateral SI as guided by individual-specific neuroimage data. The sonication target is indicated as the intersection of the green orthogonal crosshairs shown in the triplanar views (i.e., axial, sagittal, and coronal slices), while the thick yellow line (connecting green and red dots as intended entry to target points) and green line represent the orientation of the planned and guided sonication beam paths, respectively. In the lower right panel of 3D rendered view, the four colored dots show the locations of anatomical markers used for the spatial co-registration between the subject and the neuroimage data. ‘R’ and ‘L’ denote right and left, respectively.

