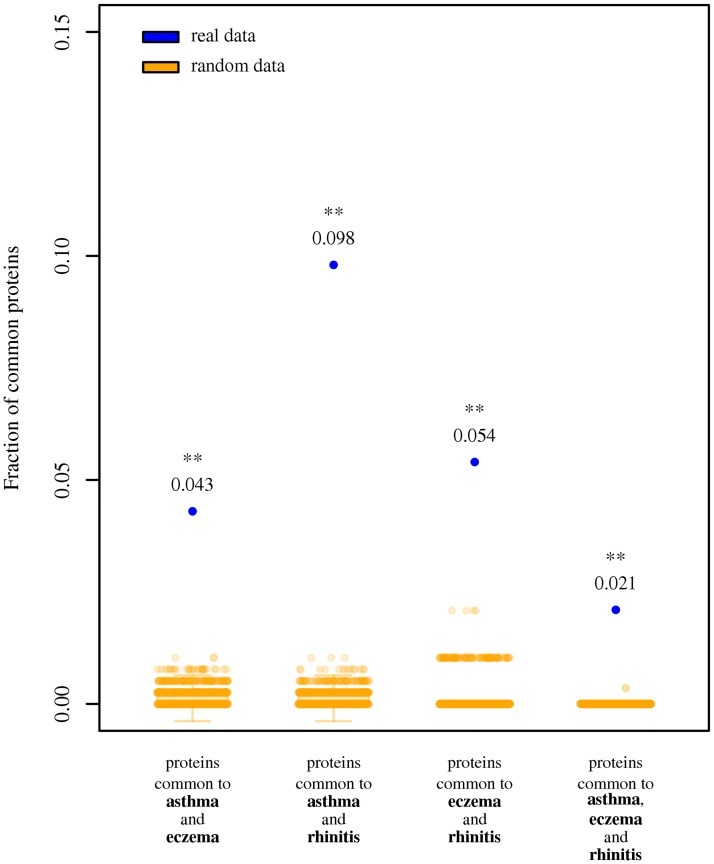
Fig 1. Fraction of proteins associated to asthma, eczema and rhinitis.
Blue dots indicate the observed fraction of proteins. Orange scatter boxplots indicate random expectation. One asterisk: observed results are significantly larger than random expectation (z-test; P < 0.05). Two asterisks: observed results are significantly larger than random expectation (z-test; P < 0.01).

