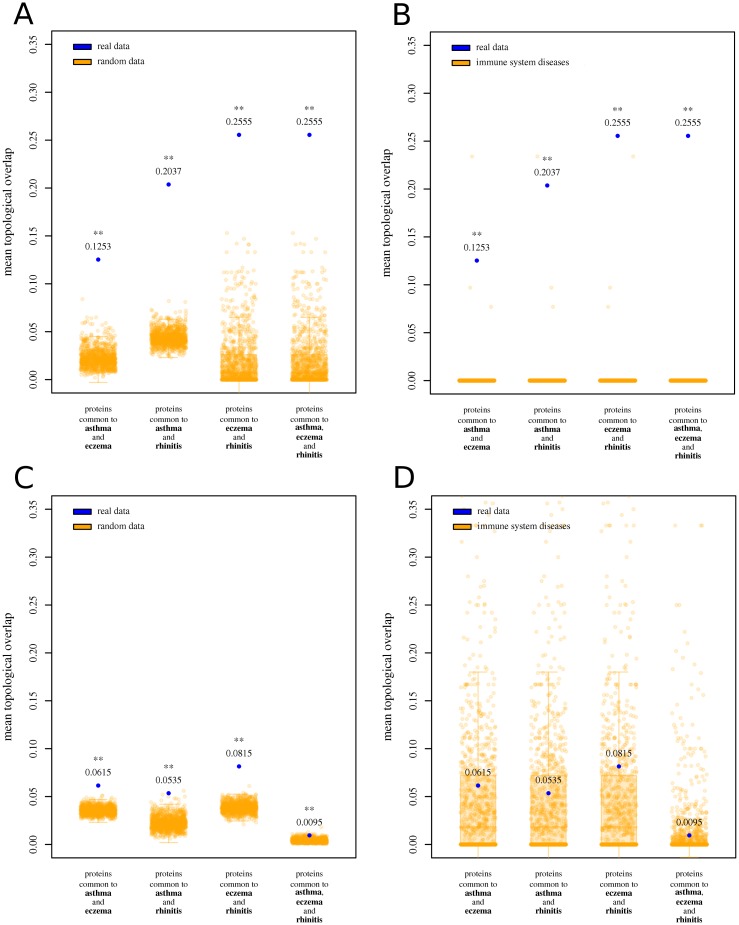
Fig 4. Mean topological overlap for proteins associated to asthma, eczema and rhinitis.
(A) Blue dots indicate the observed mean topological overlap (TO) for proteins common to asthma and eczema, asthma and rhinitis, eczema and rhinitis, and common to all three. Orange scatter boxplots indicate random expectation. (B) Blue dots indicate the observed mean TO for proteins common to the combinations of diseases shown in the previous figure. Orange scatter boxplots indicate observed TO values for pairs/trios of immune system diseases. (C) Blue dots indicate the observed mean TO between proteins unique to asthma and unique to eczema, unique to asthma and unique to rhinitis, unique to eczema and unique to rhinitis, and unique to each disease. Orange scatter boxplots indicate random expectation. (D) Blue dots indicate the observed mean TO for proteins unique to the combinations of diseases shown in the previous figure. Orange scatter boxplots indicate observed TO values for pairs/trios of immune system diseases. One asterisk: observed results are significantly larger than random expectation (P < 0.05). Two asterisks: observed results are significantly larger than random expectation (P < 0.01).

