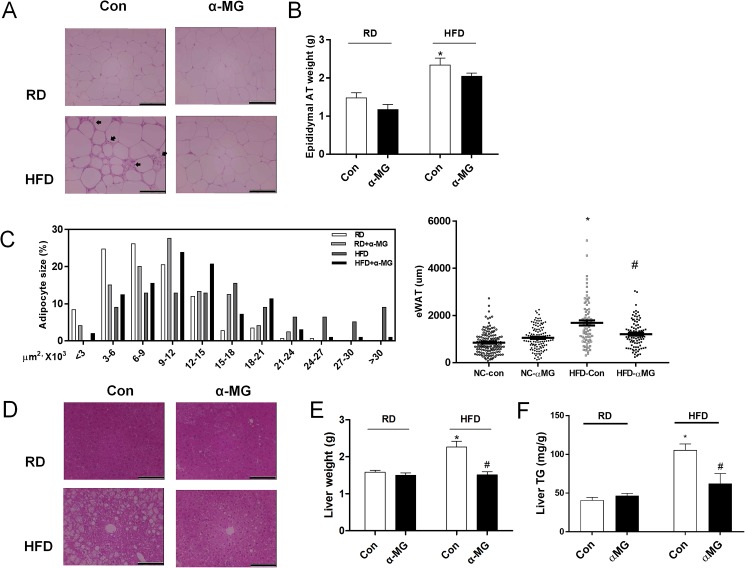
Fig 2. α-MG reduced liver tissue weight and epididymal adipose tissue in HFD mice.
(A) Pathological grade from histological examination of the adipose tissues stained with hematoxylin and eosin. (B) Adipose tissue weight changes of WT mice and α-MG-treated mice. (C) Adipocytes size of adipose tissue in WT mice and α-MG-treated mice. (D) Pathological grade from histological examination of the livers stained with hematoxylin and eosin. (E) Liver weight changes of WT mice and α-MG-treated mice. (F) TG contents of the livers from RD- or HFD-fed WT and α-MG-treated mice. Original magnification is x200 (scale bar = 100 μm). Data are shown as mean ± SEM with n = 10 animals per group. *P < 0.05 compared to RD mice. #P < 0.05 compared to HFD mice.

