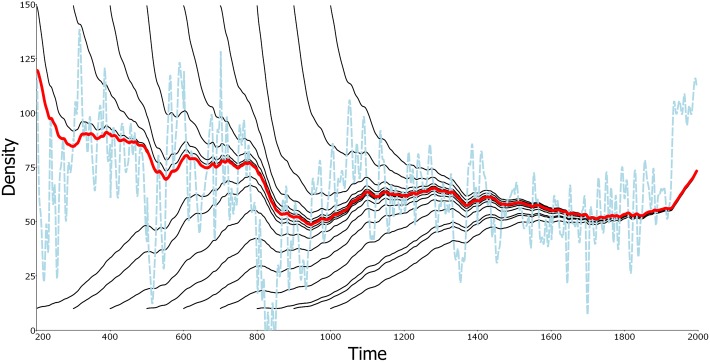
Fig 1. Convergence on an asymptotic environmentally determined trajectory (AEDT).
Illustration using the Beverton-Holt model. Red line: the AEDT, N*(t); thin black solid lines: different trajectories, N(t), for different starting times, s (= 200, 300,…, 1000), and 2 different initial values, N(s) (upper versus lower lines). Light blue dashed line: the moving equilibrium, , reflecting the underlying physical environment at each point in time, which, for illustration here, depends on the reconstructed mean Northern Hemisphere temperature, 200–1995 CE (S1 Text Part C). Backward convergence is illustrated by the increasing closeness of N(t) to N*(t), for t > 1000 as the starting time, s, is decreased. Forward convergence is illustrated by the fact that, by 1950, most trajectories are indistinguishable from the red trajectory, N*(t). (For the data, see S1 Data).

