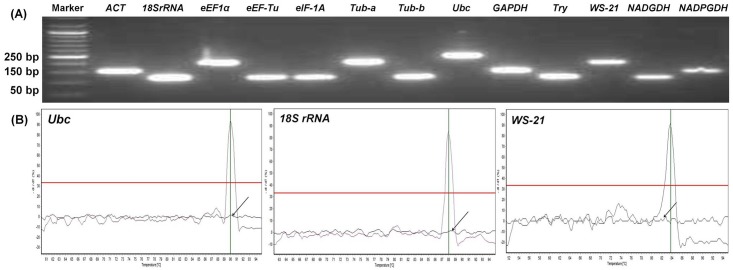
Fig 1. Specificity of primers used for RT-qPCR analysis in B. poitrasii.
A) Agarose gel electrophoresis and analysis of amplified products obtained from RT-qPCR. The electrophoresis was done on 2% agarose gel. The names of candidate reference genes are mentioned on top. The figures on left indicate the size of PCR amplicons in base pairs. B) Melting curves indicating single peaks for three representative genes. Arrow indicates the melting curve for the RT-qPCR reaction without template.

