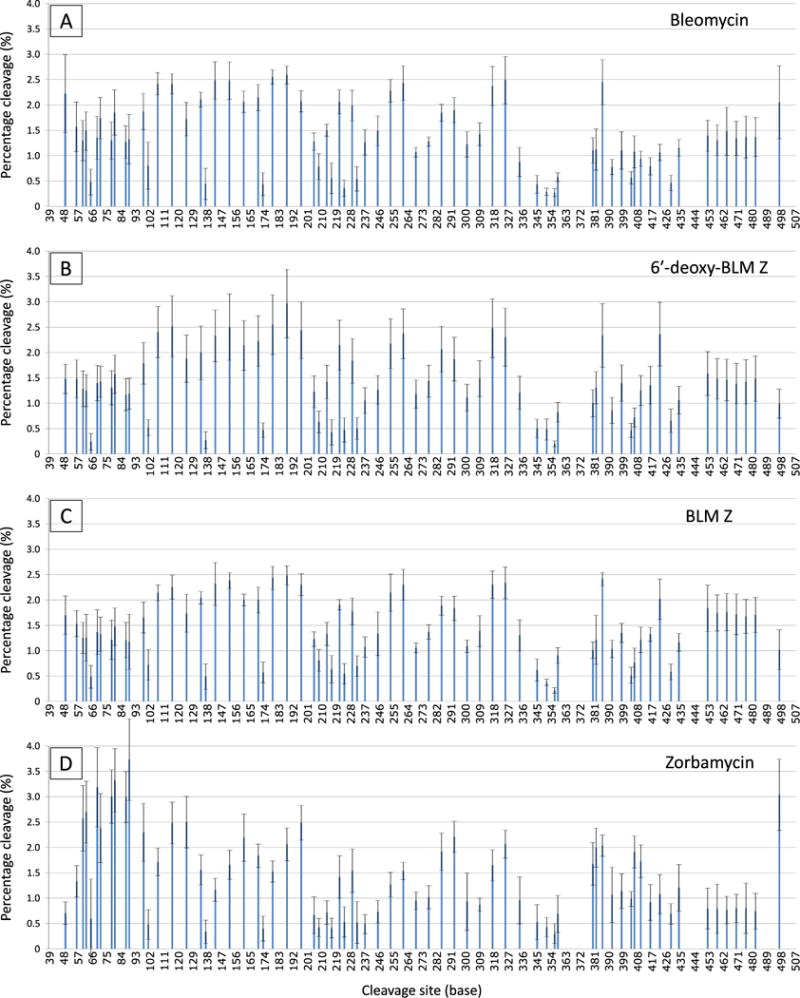
Figure 3. The cleavage profiles of BLM and the three analogues.

The cleavage profiles of BLM and the three analogues at 0.20 mM were corrected for end-label bias and the 3′- and 5′-end labelled data was amalgamated. Each bar represents a cleavage site on the RTGTAY sequence. The intensity of cleavage (percentage cleavage) was normalised to enable profile comparison between the analogues. Error bars indicate the standard deviation of the mean.
