
Figure 4. Comparison of the cleavage profile between BLM and the three analogues.
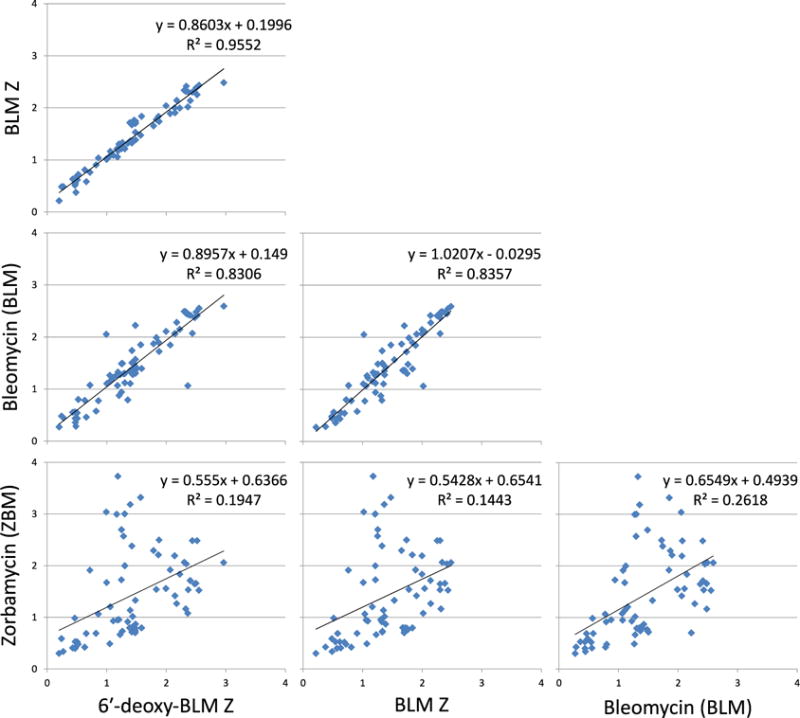
The cleavage site intensity data for BLM and each analogue were plotted against each other. At each cleavage site, the intensity was plotted for each of the compounds being compared as × and y values. A correlation coefficient between each of the profiles was then calculated to examine their similarity.