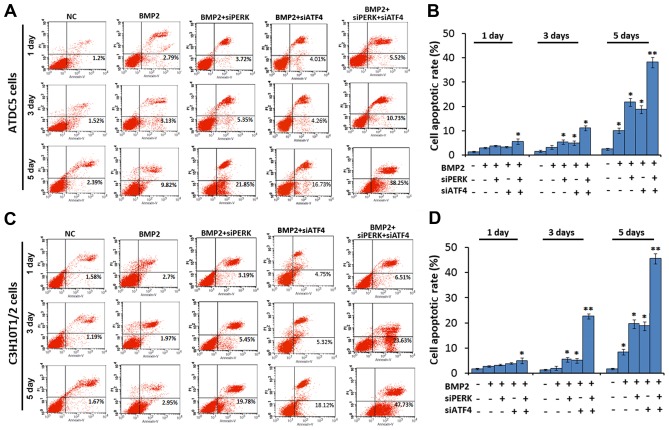
Figure 4.
Analysis of apoptosis by FCM. (A and C) FCM analysis with Annexin V-PI staining was performed to evaluate the percentage of apoptotic cells in the BMP2 (300 ng/ml)-stimulated (A) ATDC5 and (C) C3H10T1/2 cells on culture days 1, 3 and 5. The percentage of apoptotic ATDC5 and C3H10T1/2 cells in the BMP2 + siPERK + siATF4 groups was significantly increased compared with that of the cells in the BMP2 + siPERK, BMP2 + siATF4 cell groups, and the controls. (B and D) Analysis of results of cell apoptosis. Data are presented as the means ± SD for relative apoptosis normalized to control cells for 3 independent experiments. Columns represent the means of 4 separate experiments; bars represent SD. *P<0.05 as determined by the Student's t-test, vs. BMP2 and BMP2 + siPERK + siATF4 group; **P<0.01, vs. BMP2 + siPERK and BMP2 + siPERK + siATF4 group; BMP2 + siATF4 and BMP2 + siPERK + siATF4 group. Representative images from FCM analysis are shown. FCM, flow cytometry; BMP2, bone morphogenetic protein 2.

