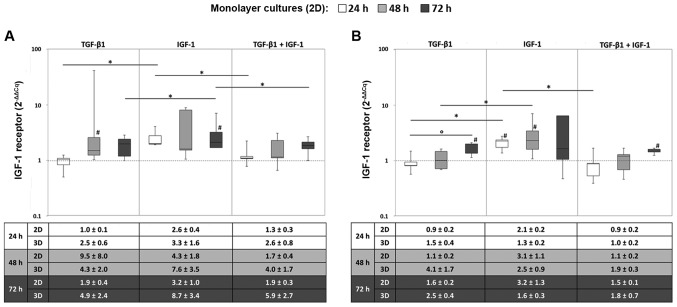
Figure 1.
Expression of the IGF-1 receptor in (2D) monolayer and (3D) pellet cultures under (A) hypoxic and (B) normoxic culture conditions. Human chondrocytes were cultured as monolayer or pellet cultures and stimulated with TGF-β1 and/or IGF-1. After 24, 48 and 72 h, RNA was isolated and the gene expression rate of the IGF-1 receptor was quantified using qPCR. Data in the diagrams (from monolayer cultures) are presented as box plots with median, interquartile ranges and minimum/maximum values (n=5). Statistical analysis was conducted using the Wilcoxon signed rank test. *P≤0.05, comparison between growth factors; °P≤0.05, comparison between time points; #P≤0.05, comparison to the starting time point (0 h). Data in the tables in the bottom panels are presented as the mean values ± SEM from monolayer (2D, n=5) and pellet (3D, n=3) cultures. IGF-1, insulin-like growth factor-1; TGF-β1 transforming growth factor-β1.

