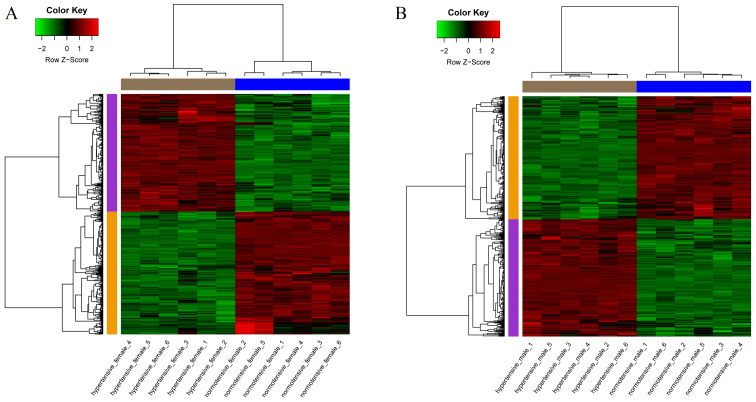
Figure 1.
Heatmap plot of differentially expressed genes accross all samples. (A) Hypertensive female (HF) vs. normotensive female (NF); (B) hypertensive male (HM) vs. normotensive male (NM). Red stands for high expression value and green stands for low expression value. The changes of color from green to red stands for the changes of expression value from low to high.

