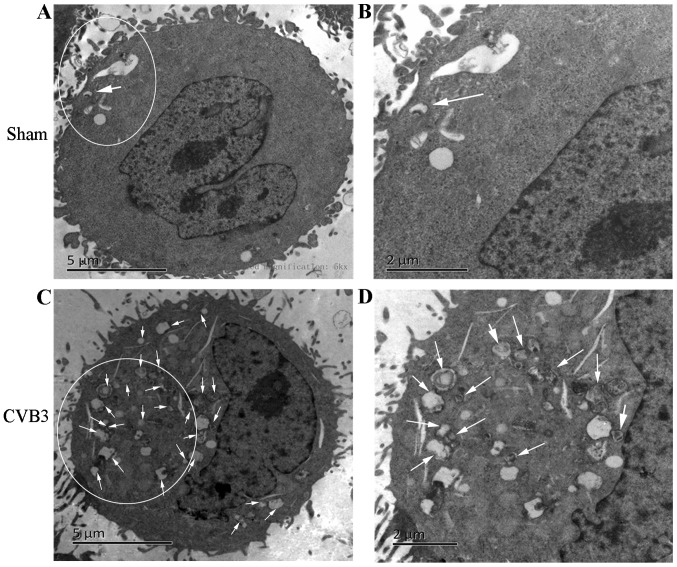
Figure 3.
TEM analysis of HeLa cells at 24 h.p.i. HeLa cells were collected at 24 h.p.i. and subjected to electron microscopic observation. Abundant autopha-gosome-like vesicles with double membranes (0.2–0.5 µm in size) clustered in the CVB3-infected group compared with the control group (white arrows). (A and B) The normal structure in the sham group. (C and D) The changes in CVB3-infected HeLa cells. Arrows indicate representative autophagosomes that would be scored positive in (B), with double membranes 0.2–0.5 µm in size. TEM, transmission electron microscopy; h.p.i., hours post-inoculation; CVB3, coxsackievirus B3.

