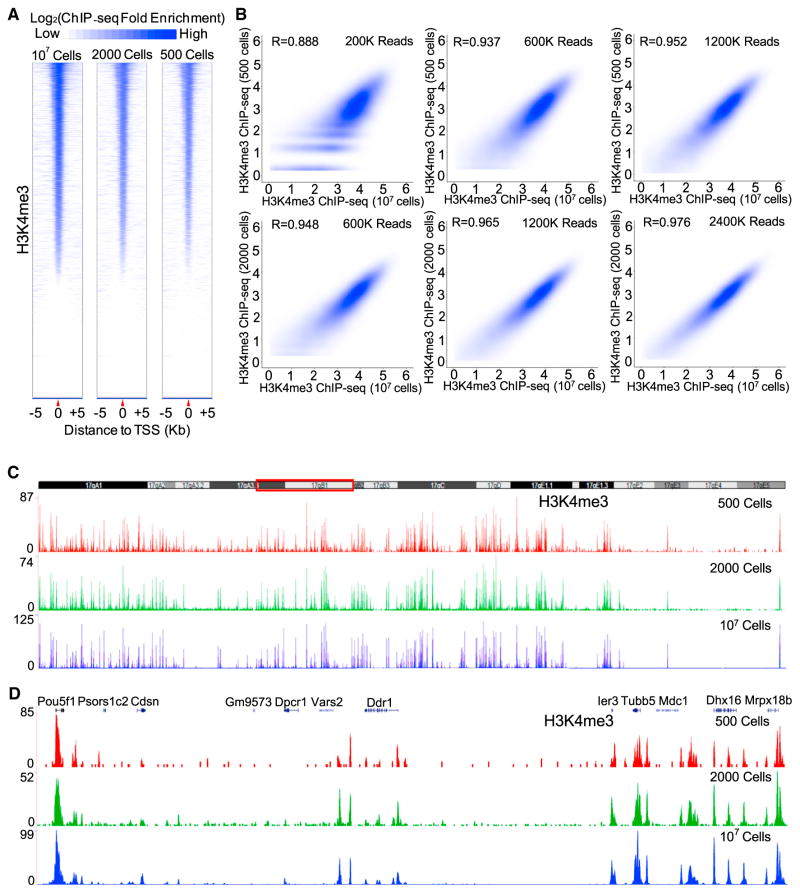
Figure 1. RP-ChIP-Seq.
(A) Heatmaps of H3K4me3 5 kb upstream and downstream of TSS in 107, 2,000, or 500 mESCs, rank ordered based on H3K4me3 in 107 mESCs.
(B) Contour plots (Spearman correlation coefficient, R) of H3K4me3 on promoters by RP-ChIP-seq in 500 or 2,000 mESCs at the indicated mouse reads and the standard ChIP-seq in 107 mESCs at 163 million reads.
(C and D) Plots of H3K4me3 peaks on chromosome 17 (C) or the enlarged region boxed in red in C (D) using 500, 2,000, and 107 mESCs. See also Figure S1 and Tables S1 and S2.

