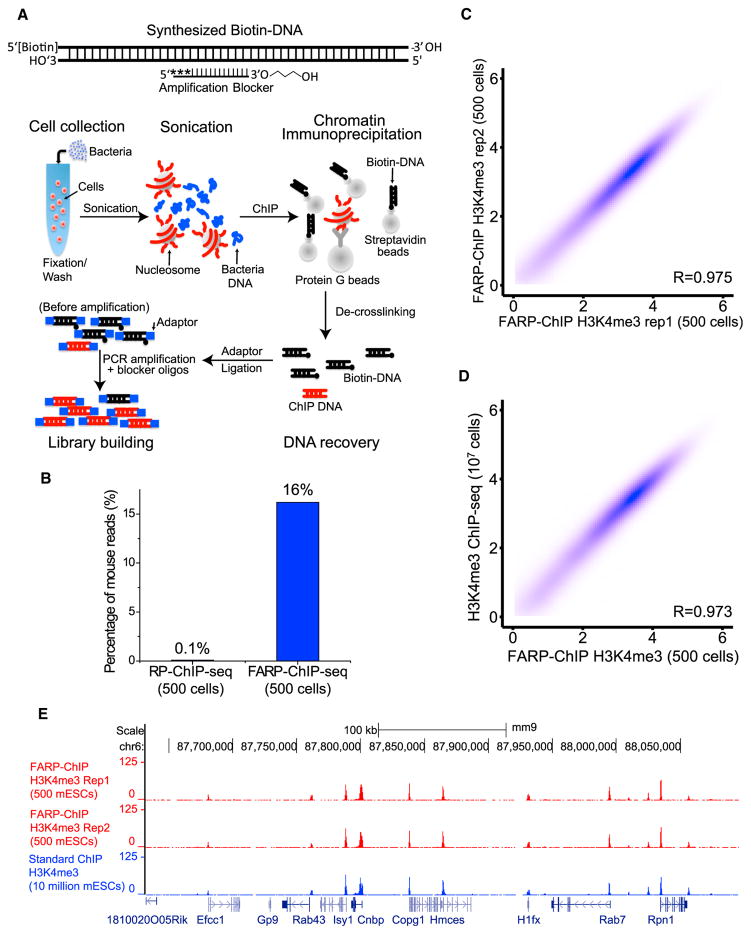
Figure 2. Favored Amplification RP-ChIP-Seq.
(A) Top: the biotin-DNA carrier annealed to the blocker oligo carrying a 3′ modified 3-carbon spacer and 5′ 3 phosphorothioate modifications (asterisks). Bottom: cells of interest (red) were mixed with bacteria (blue), fixed, washed, and sonicated. Biotin-DNA bound to streptavidin beads and antibody-bound protein G beads were added for ChIP.
(B) FARP-ChIP-seq resulted in increased ratios of mapped mouse reads to total reads.
(C and D) Contour plots (as log2 of the average read density within 2 kb upstream and downstream of TSS. Spearman correlation coefficient, R) between two biological replicates of FARP-ChIP-seq in 500 mESCs (C) or between 500 mESC FARP-ChIP-seq and the 107 mESCs standard ChIP-seq. (E) Enrichment at the indicated genes on chromosome 6 was mapped by the indicated methods.

