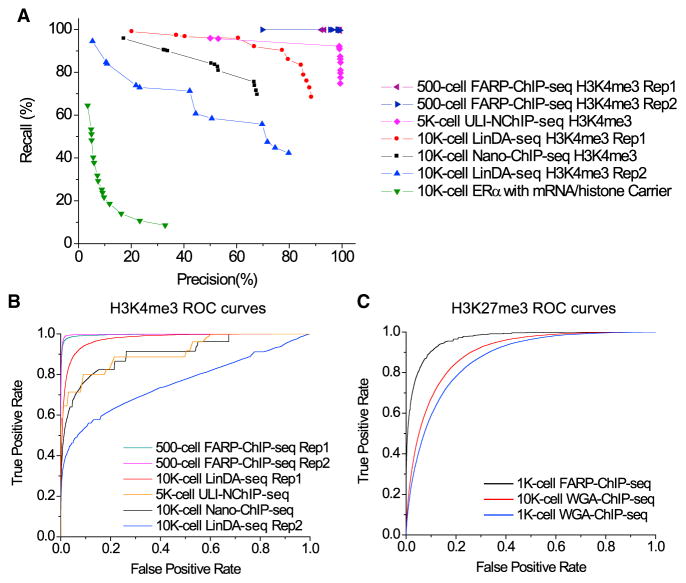
Figure 3. Comparisons among ChIP-Seq Methods for Low Cell Numbers.
(A) Precision-recall curves for H3K4me3 or ERα peaks mapped by the indicated methods. Percentages of the top 40% peaks mapped by the indicated methods that overlapped with the respective peaks mapped by standard ChIP-seq in ≥106 cells (x axis, precision) or mapped by standard ChIP-seq that overlapped with the respective peaks mapped by the indicated methods (y axis, recall). Curves are drawn by changing the p value threshold used in calling peaks for indicated method.
(B) ROC curve for H3K4me3 comparisons. True-positive rate, the number of true-positive 2-kb regions divided by the number of “true” regions (25,000); false-positive rate, the number of false-positive regions divided by the number of “false” regions.
(C) ROC curve H3K27me3 comparisons. True-positive rate, the number of true-positive 5-kb regions divided by the number of “true” regions (25,000); false-positive rate: the number of false-positive regions divided by the number of “false” regions.
The legend for ROC curves in (B) and (C) are ordered from best to worse AUC (area under curve) values. See also Figure S3 and Tables S1 and S2.

