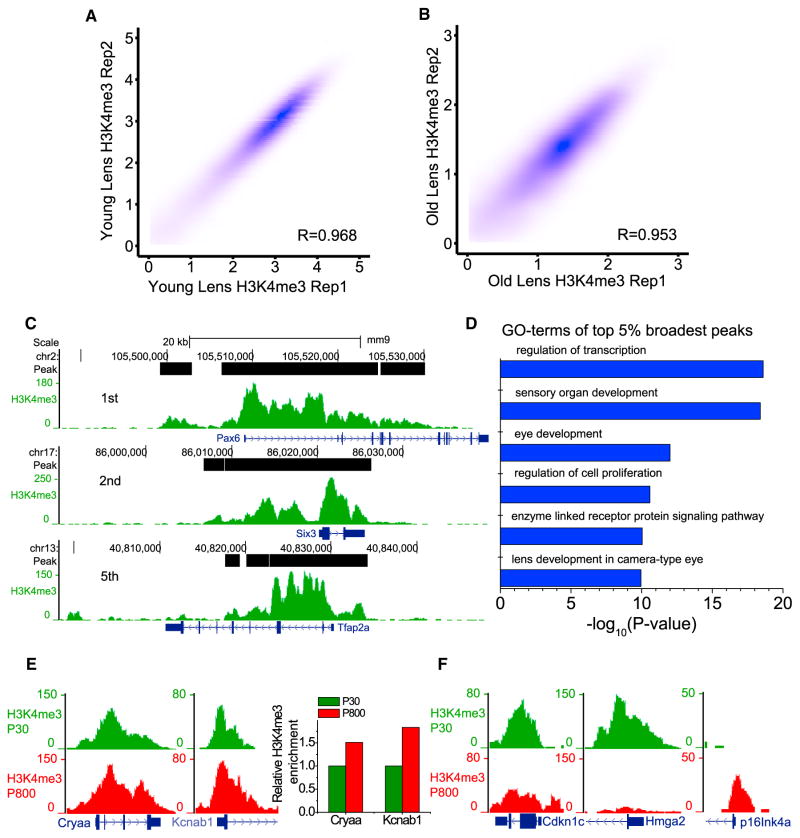
Figure 4. RP-ChIP-Seq of H3K4me3 in One Dissected Mouse Lens.
(A and B) Contour plots (Spearman correlation coefficient, R) between H3K4me3 on promoters obtained by RP-ChIP-seq in biological replicates of young (A) and old single lens (B).
(C) Genome browser view of the representative top three broadest H3K4me3 peaks in young lens. (D) GO-term analysis of the top broadest H3K4me3 peaks in young lens.
(E) Browser view of Cryaa and Kcnab1 loci exhibiting aging-associated H3K4me3 increase in lens. The bar plot shows the relative H3K4me3 change at the two loci quantified by the normalized number of total reads falling on the promoter peaks.
(F) Browser view of representative aging-associated H3K4me3 changes in lens.

