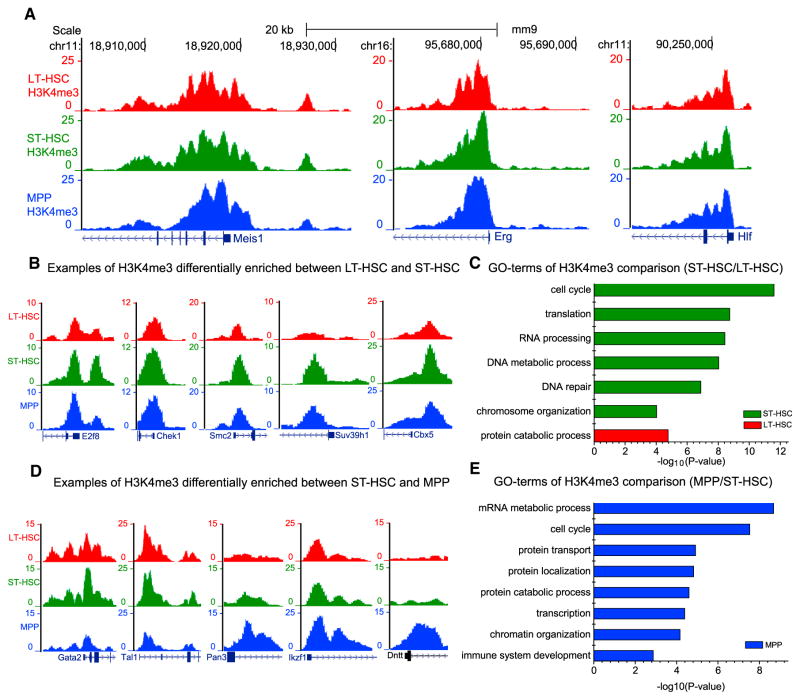
Figure 6. Comparison of H3K4me3 between HSC Subtypes.
(A) Genome browser view of common broad H3K4me3 peaks on genes in the HSC subtypes.
(B–E) Genome browser view of H3K4me3 differences in genes in the HSC subtypes (B and D) and GO-term of genes with significant changes of promoter H3K4me3 between indicated HSC subtypes (C and E). Green, red, or blue bars represent ST-HSC, LT-HSC, or MPP enriched GO terms, respectively. No ST-HSC enriched GO terms were found.

