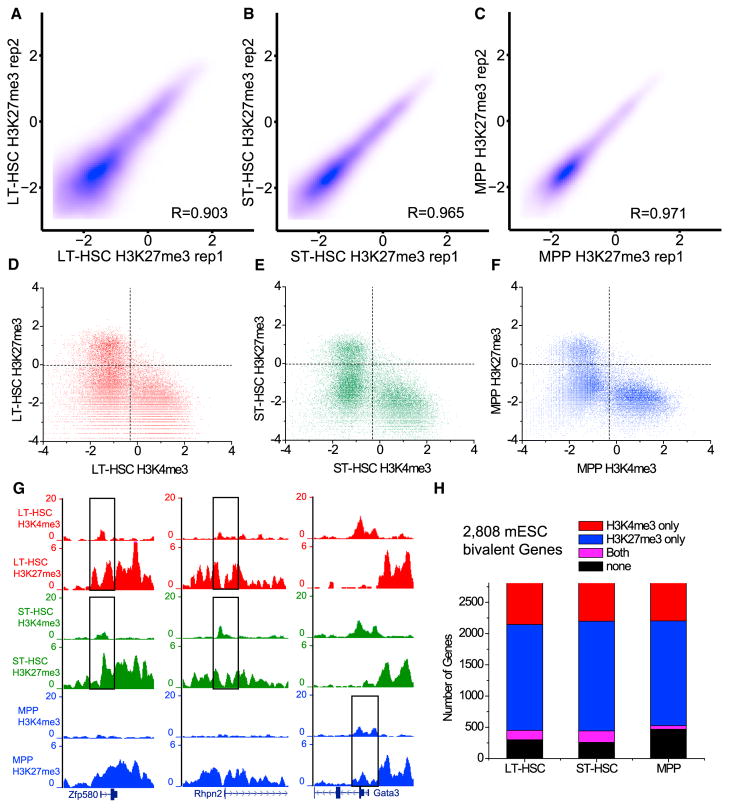
Figure 7. Genes for Hematopoietic Lineage Differentiation Are Not Generally Marked by H3K4me3/HK27me3 Bivalency in HSCs.
(A–C) Contour plots (Spearman correlation coefficient, R) between H3K27me3 (plotted as log2 of the average read density within 5 kb upstream and downstream of TSS) on promoters obtained by FARP-ChIP-seq in biological replicates of the HSC subtypes.
(D–F) Scatterplots of H3K4me3 and H3K27me3 enrichment (plotted as log2 of the average read density within 2 kb upstream and downstream of TSS) based on FARP-ChIP-seq in the HSC subtypes.
(G) Genome browser view of bivalent genes found by FARP-ChIP-seq in the HSC subtypes and by previous studies. Rectangles outline the bivalent promoters. (H) Bar plot showing how bivalent genes found in mESCs are resolved in HSC subtypes mapped by FARP-ChIP-seq.

