Figure 3. Identify transcriptional network regulated by KLF4-mCpG interactions.
(A) RNA-seq data before (0 hr) and after (48 hr) KLF4 WT induction. The pink dots were determined as differential expressed genes (DEGs) (p<0.001). (B) Overlap between DEGs in KLF4 WT and R458A cells, showing that a total of 613 genes were significantly regulated by KLF4 WT, 115 of which were also significantly regulated by KLF4 R458A. Among the rest 500 genes significantly regulated by KLF4 WT but not R458A (WT only DEGs), 308 of them were up-regulated by KLF4 WT only. (C) Four examples of KLF4 WT only DEGs. (D) Overlap between KLF4 WT and R458A KLF4 ChIP-seq peaks (48 hr +Dox), indicating that ~2733 peaks can be only bound by KLF4 WT; ~1157 peaks bound by both KLF4 WT and R458A, whereas R458A alone only bound a few new sites. (E) ChIP-Seq for KLF4 WT and R458A on and surrounding RHOC promoter as an example. RNA-seq at the same region was also shown, pre and post KLF4 WT and R458A induction, respectively. (F) Percentage of ChIP-seq peaks with mCpGs evaluated by whole genome bisulfite sequencing analysis. A significant enrichment was observed for methylated CpG in KLF4 WT-specific peaks (Blue bar) as compared to KLF4 R458A shared peaks (orange bar). (G) Motifs identified for KLF4-mCpG binding in KLF4 WT-specific peaks (Left) and for KLF4 R458A shared peaks (Right), respectively.
DOI: http://dx.doi.org/10.7554/eLife.20068.006

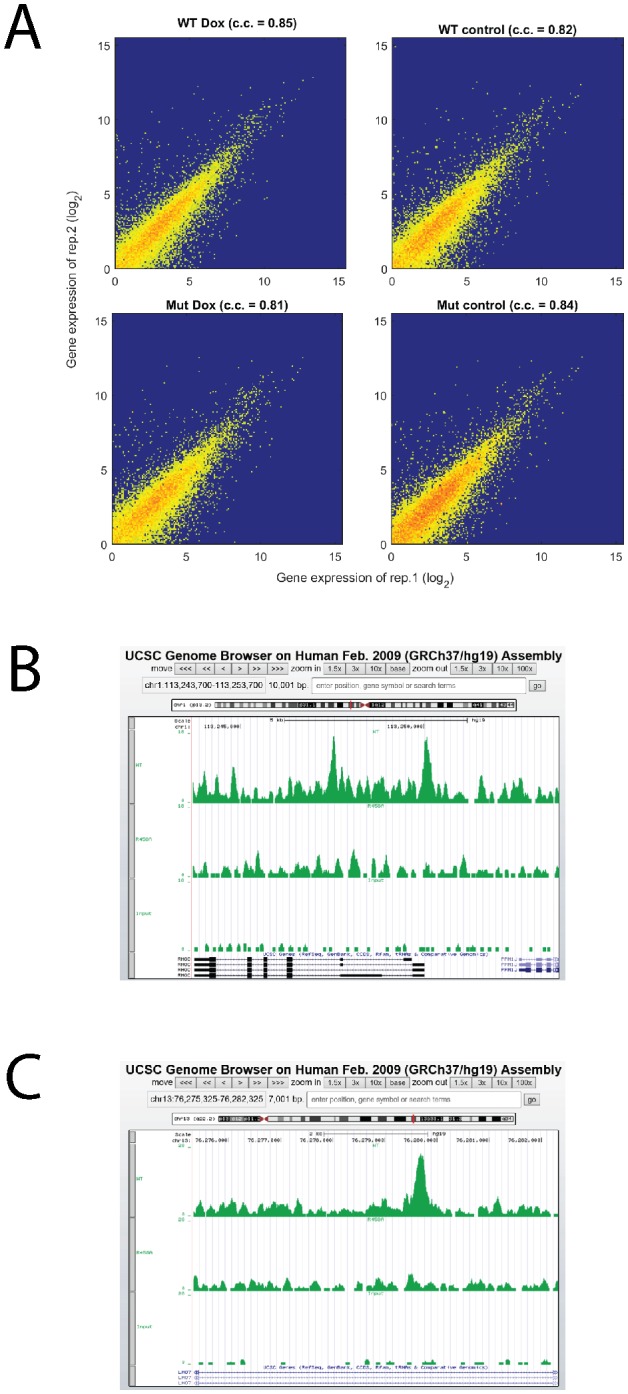
Figure 3—figure supplement 1. Analysis of RNA-seq and ChIP-seq data.