. 2017 May 8;6:e23570. doi: 10.7554/eLife.23570

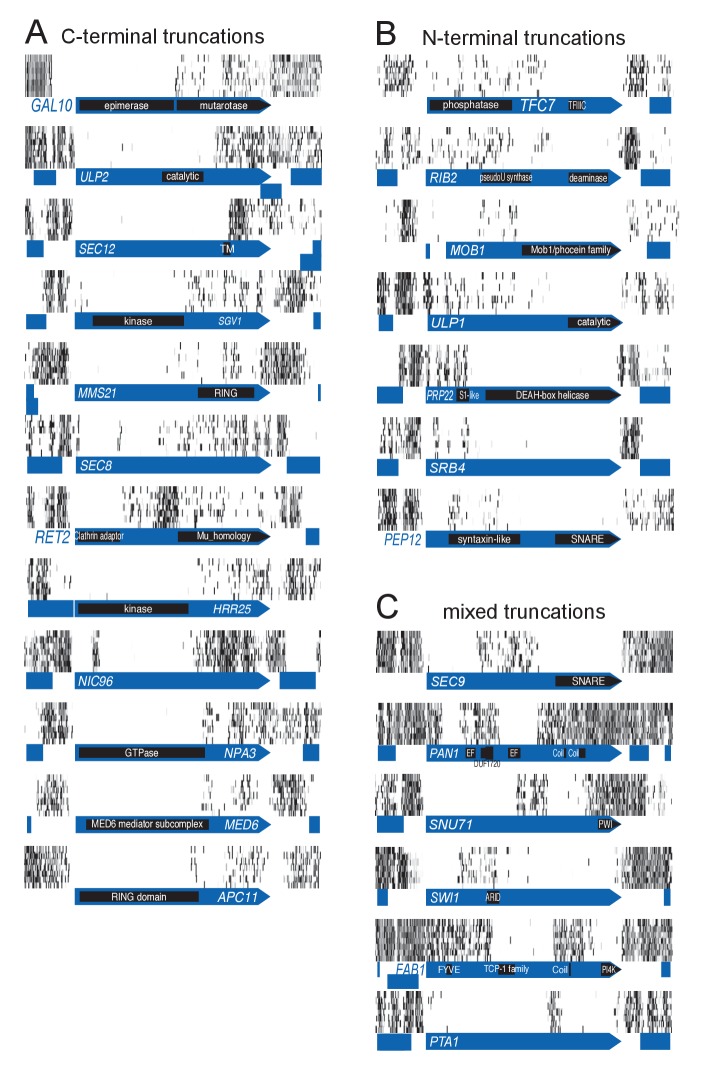
Figure 2. Examples of genes showing partial loss of transposon coverage.

The grey level is proportional to the number of sequencing reads. Known functional domains are indicated. (A) Essential genes for which C-terminal truncations yield a viable phenotype. (B) Essential genes for which N-terminal truncations yield a viable phenotype. (C) Essential genes for which various truncations yield a viable phenotype.

DOI: http://dx.doi.org/10.7554/eLife.23570.008

Figure 2.

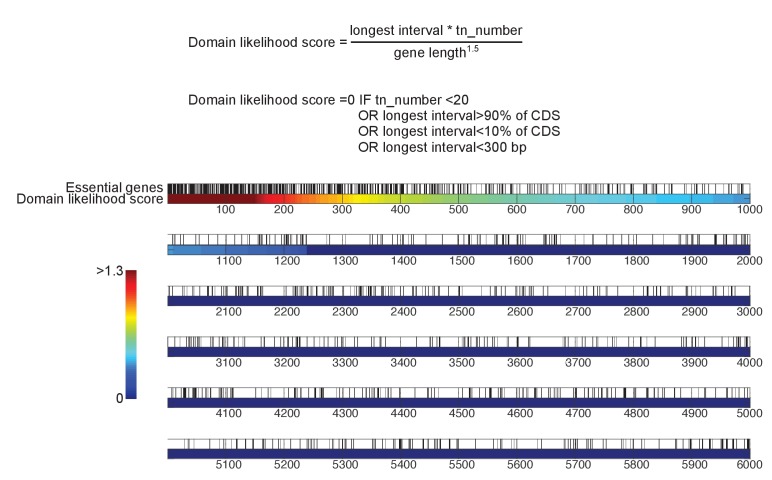
Figure 2—figure supplement 1. Detection of essential protein domains.

Figure 2—figure supplement 1.

Top, algorithm to detect essential protein domains. This algorithm is implemented in Source code 2. For each gene, a score is computed as follows: the longest interval between transposon n and transposon n + 5, multiplied by the total number of transposons mapping to that gene, divided by the gene length to the power of 1.5. A score of 0 is assigned to genes targeted by less than 20 transposons, in which the longest interval is smaller than 300 bp, and/or in which the longest interval represents more than 90% or less than 10% of the CDS length. Bottom, yeast genes sorted according to their domain likelihood score. Vertical black bars above the graph indicate previously annotated essential genes.
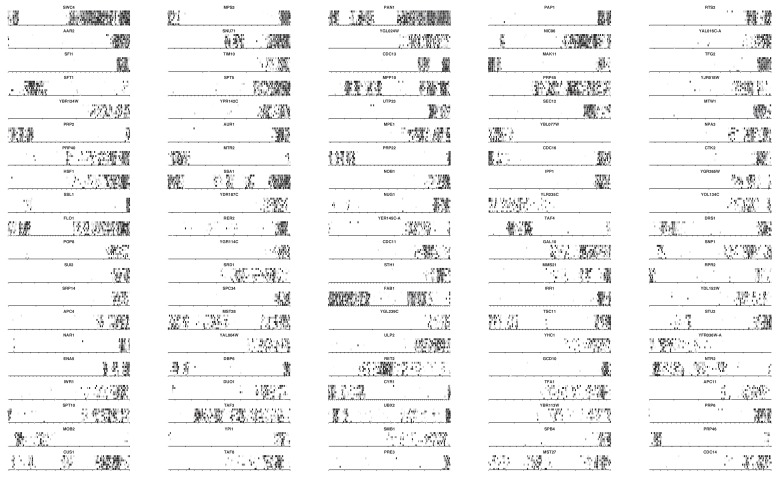
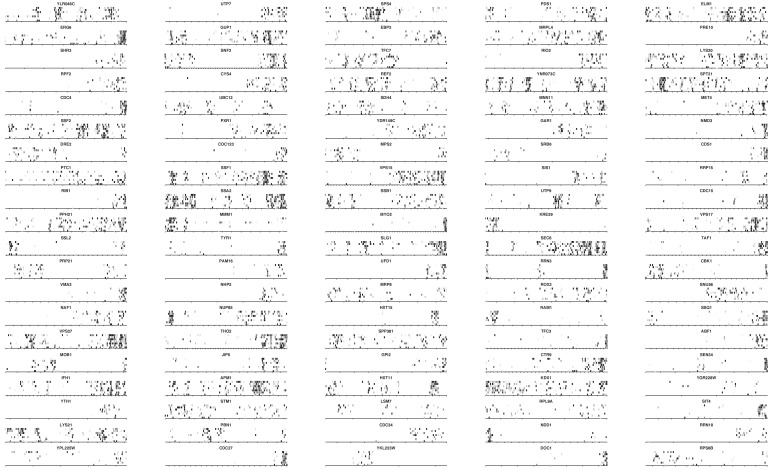
Figure 2—figure supplement 2. Transposon maps in the 100 highest scoring genes.

Figure 2—figure supplement 2.

Grey scale indicates the number of sequencing reads as in Figure 2.
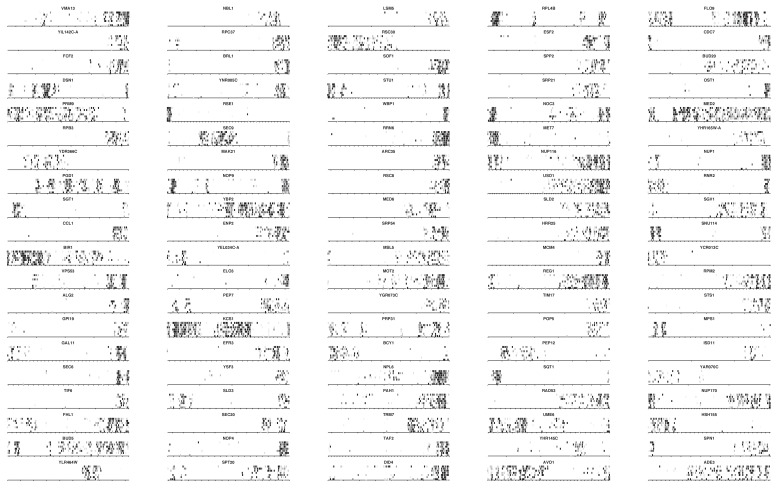
Figure 2—figure supplement 3. Transposon maps in the genes scoring 101 to 200.

Figure 2—figure supplement 3.

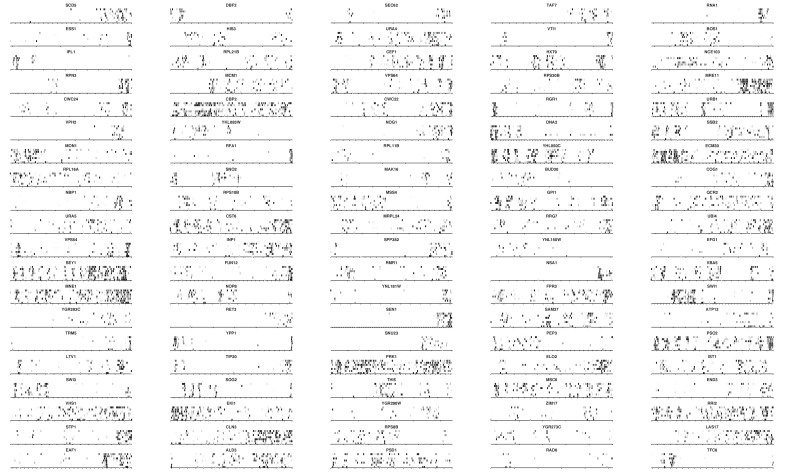
Figure 2—figure supplement 4. Transposon maps in the genes scoring 201 to 300.

Figure 2—figure supplement 4.

Figure 2—figure supplement 5. Transposon maps in the genes scoring 301 to 400.

Figure 2—figure supplement 5.