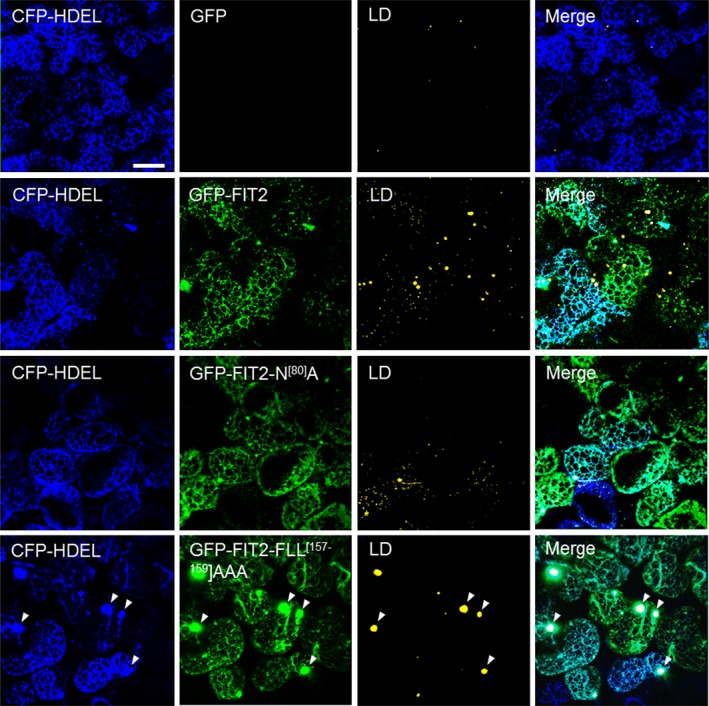
Figure 2.

FIT2 and mutated FIT2 GFP‐tagged fusion proteins localize to the ER in Nicotiana benthamiana leaf mesophyll cells. As indicated by panel labels, ER, GFP‐FIT2/FIT2 variants and LDs were visualized (via confocal microscopy) in mesophyll cells based on fluorescence signals of CFP‐HDEL (blue), N‐terminal‐GFP‐tagged FIT2 or FIT2 variants (i.e. FIT2‐N[80]A or FIT2‐FLL [157‐159] AAA) (green) and Nile red (yellow), respectively). Shown also are the corresponding merged images. Note that no GFP fluorescence signal was detectable in the cell expressing CFP‐HDEL alone (top row), as expected. Arrowheads in the bottom row indicate examples of regions of the ER with altered morphology, where both GFP‐FIT2‐FLL [157‐159] AAA and Nile red‐stained LDs appear to accumulate. All images are 2D projections of Z‐stacks of ~30 slices. Bar = 20 μm.
