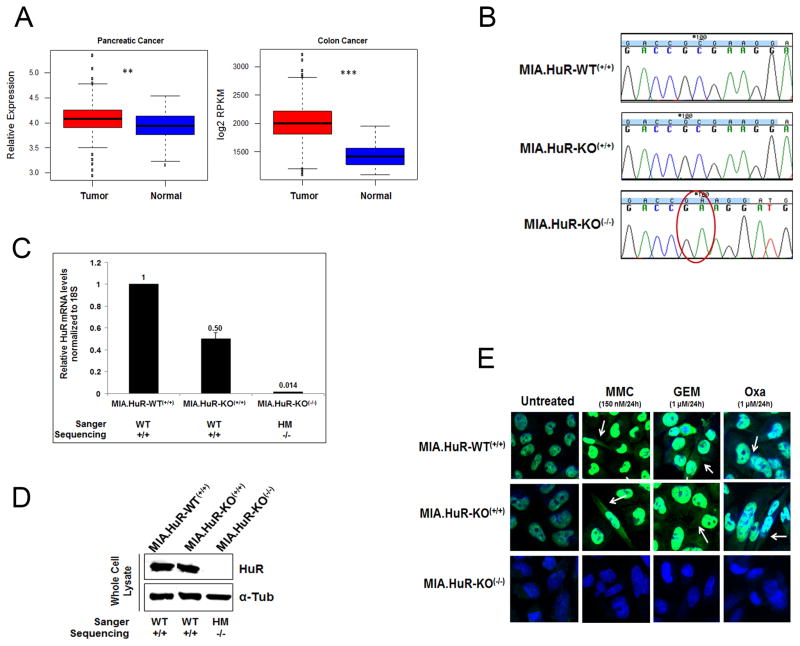
Figure 1. CRISPR-cas9 system inhibits HuR expression and localization in MIA PaCa-2 PDA cells.
A, Shown are boxplots of HuR expression levels across 519 samples comprised of normal pancreatic tissue (n=46), primary pancreatic adenocarcinomas (n=145), normal colon tissue (n=42) and colorectal cancer (n=286). For each boxplot, the black line represents the median expression value and the boxes are the 1st and 3rd quartiles. ** p<0.005; *** p<−0.005. B, Chromatograms from Sanger sequencing of HuR CRISPR-transfected purified PCR products showing the homozygous mutant [MIA.HuR-KO(−/−).1] and homozygous wild type [MIA.HuR-KO(+/+)] clones. C, Relative mRNA HuR expression was assessed in different clones by qPCR. (Note: only three clones are shown here. Complete list of clones are shown in Fig. S1B). D, Relative protein expression of HuR was assessed in different clones by immunoblot. (Note: this is a photoshop cropped image of three clones shown in Fig. S1C). E, HuR nuclear and cytoplasmic translocation was assessed by immunofluorescence upon mitomycin C (MMC), gemcitabine (GEM) and oxaliplatin (Oxa) stressors. MIA.HuR-WT(+/+) in Figure B–E is a product from MIA PaCa-2 cells with CRISPR control transfection. WT: Wild type; HM: Homozygous mutant. Note: in Fig. B–E, the MIA.HuR-WT(+/+) clone is ‘MIA.HuR’,

