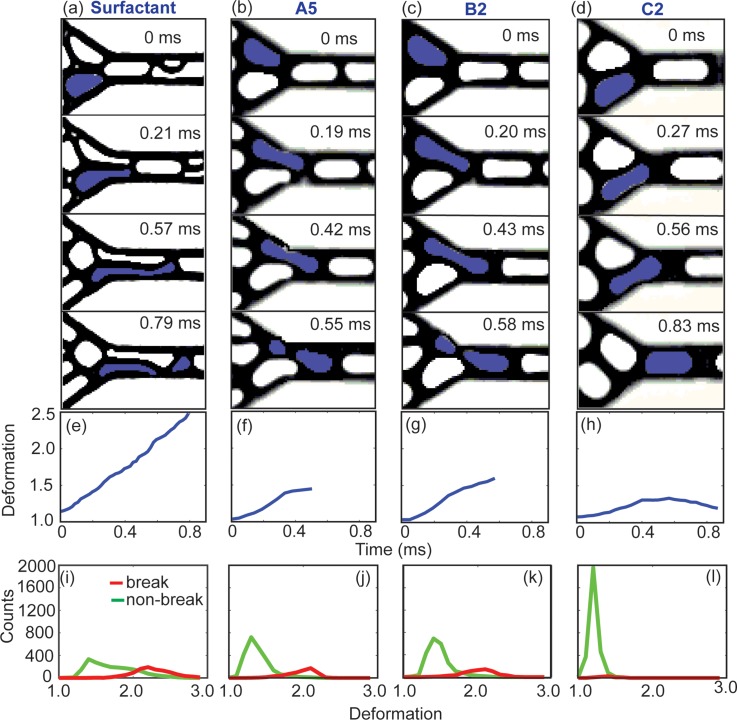
FIG. 5.
A series of snapshots showing the deformation of drops for: (a) surfactant drops, (b) NP drops in experiments A5, (c) B2, and (d) C2, respectively, all at capillary number Ca ∼ 0.15. The value of confinement factor cf is identical in (a)–(d). λ shown in (a) is identical to that in A5. (e)–(h) The deformation of the drop highlighted in blue as a function of time, corresponding to the snapshots in (a)–(d). (i)–(l) Histograms showing the distribution of the maximum deformation a drop experienced during its flow in the field of view as shown in (a)–(d). 3000 drops were recorded for each plot. The red curves denote drops that underwent break-up, and the green curves denote drops that did not undergo break-up.

